January 31st, 2019
The Economy
social-issues
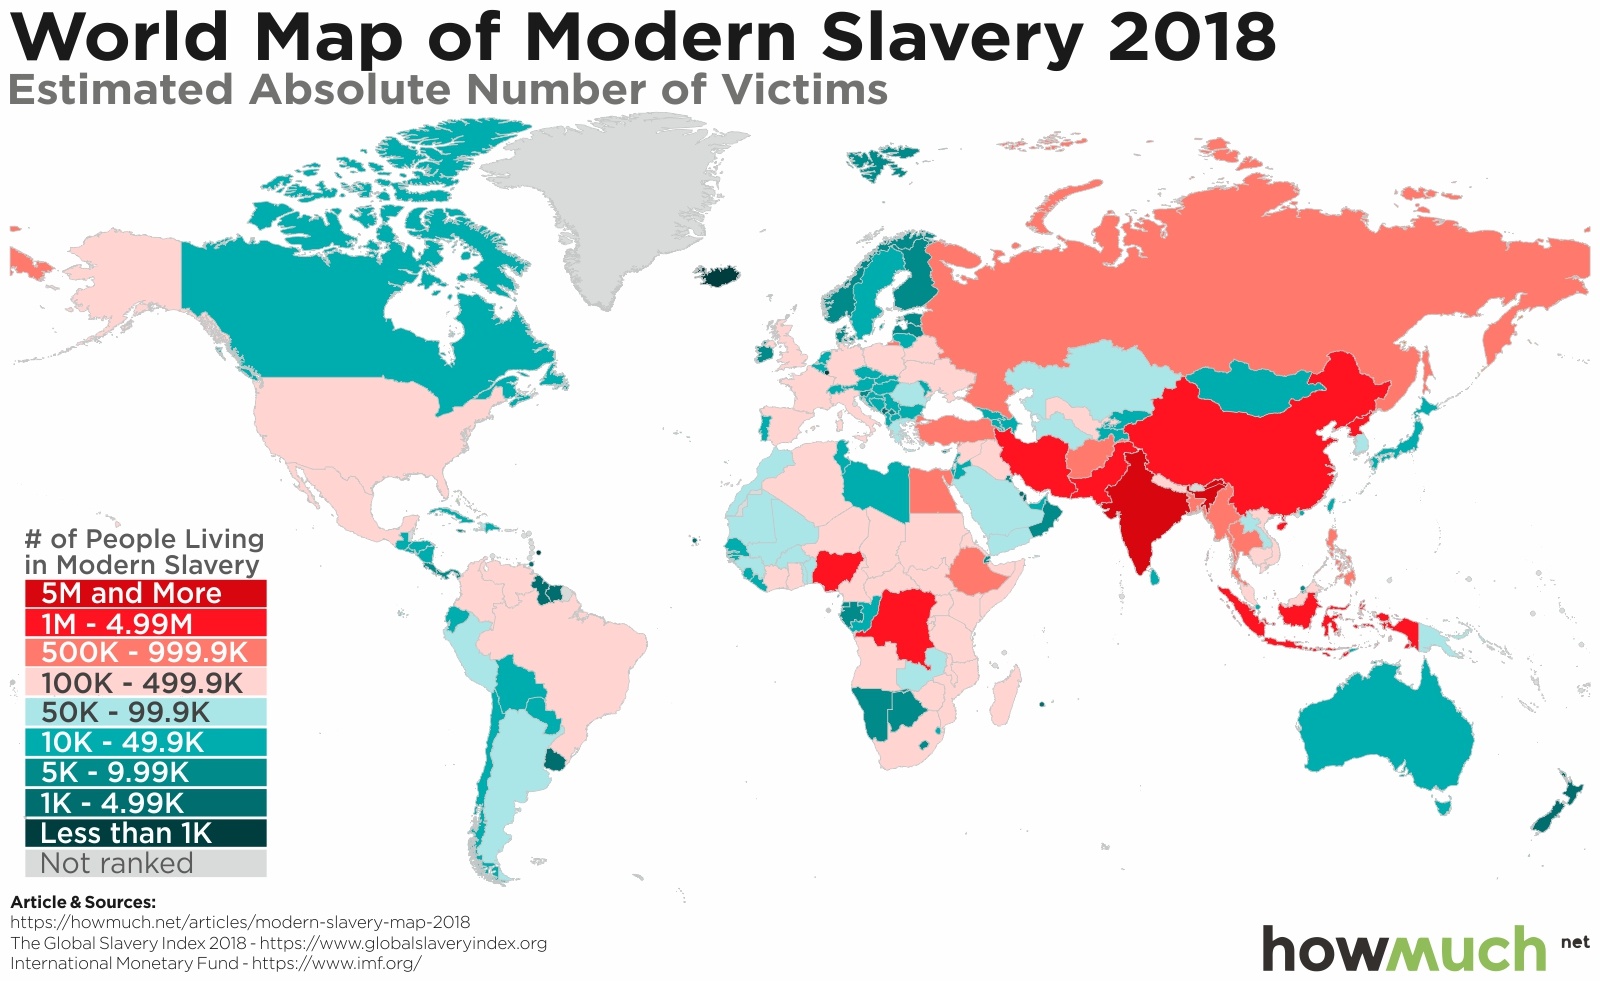
Slavery is any type of system that forces people to be treated like property, including forced marriage, labor and human trafficking. Our maps shed light on the true extent modern-day slavery around the world today.

January 25th, 2019
social-issues
The U.S. sends billions of dollars of weapons around the world every year. These maps break down America’s biggest competitors and which countries are the biggest purchasers of weapons “Made in America.”
January 14th, 2019
The Economy
social-issues
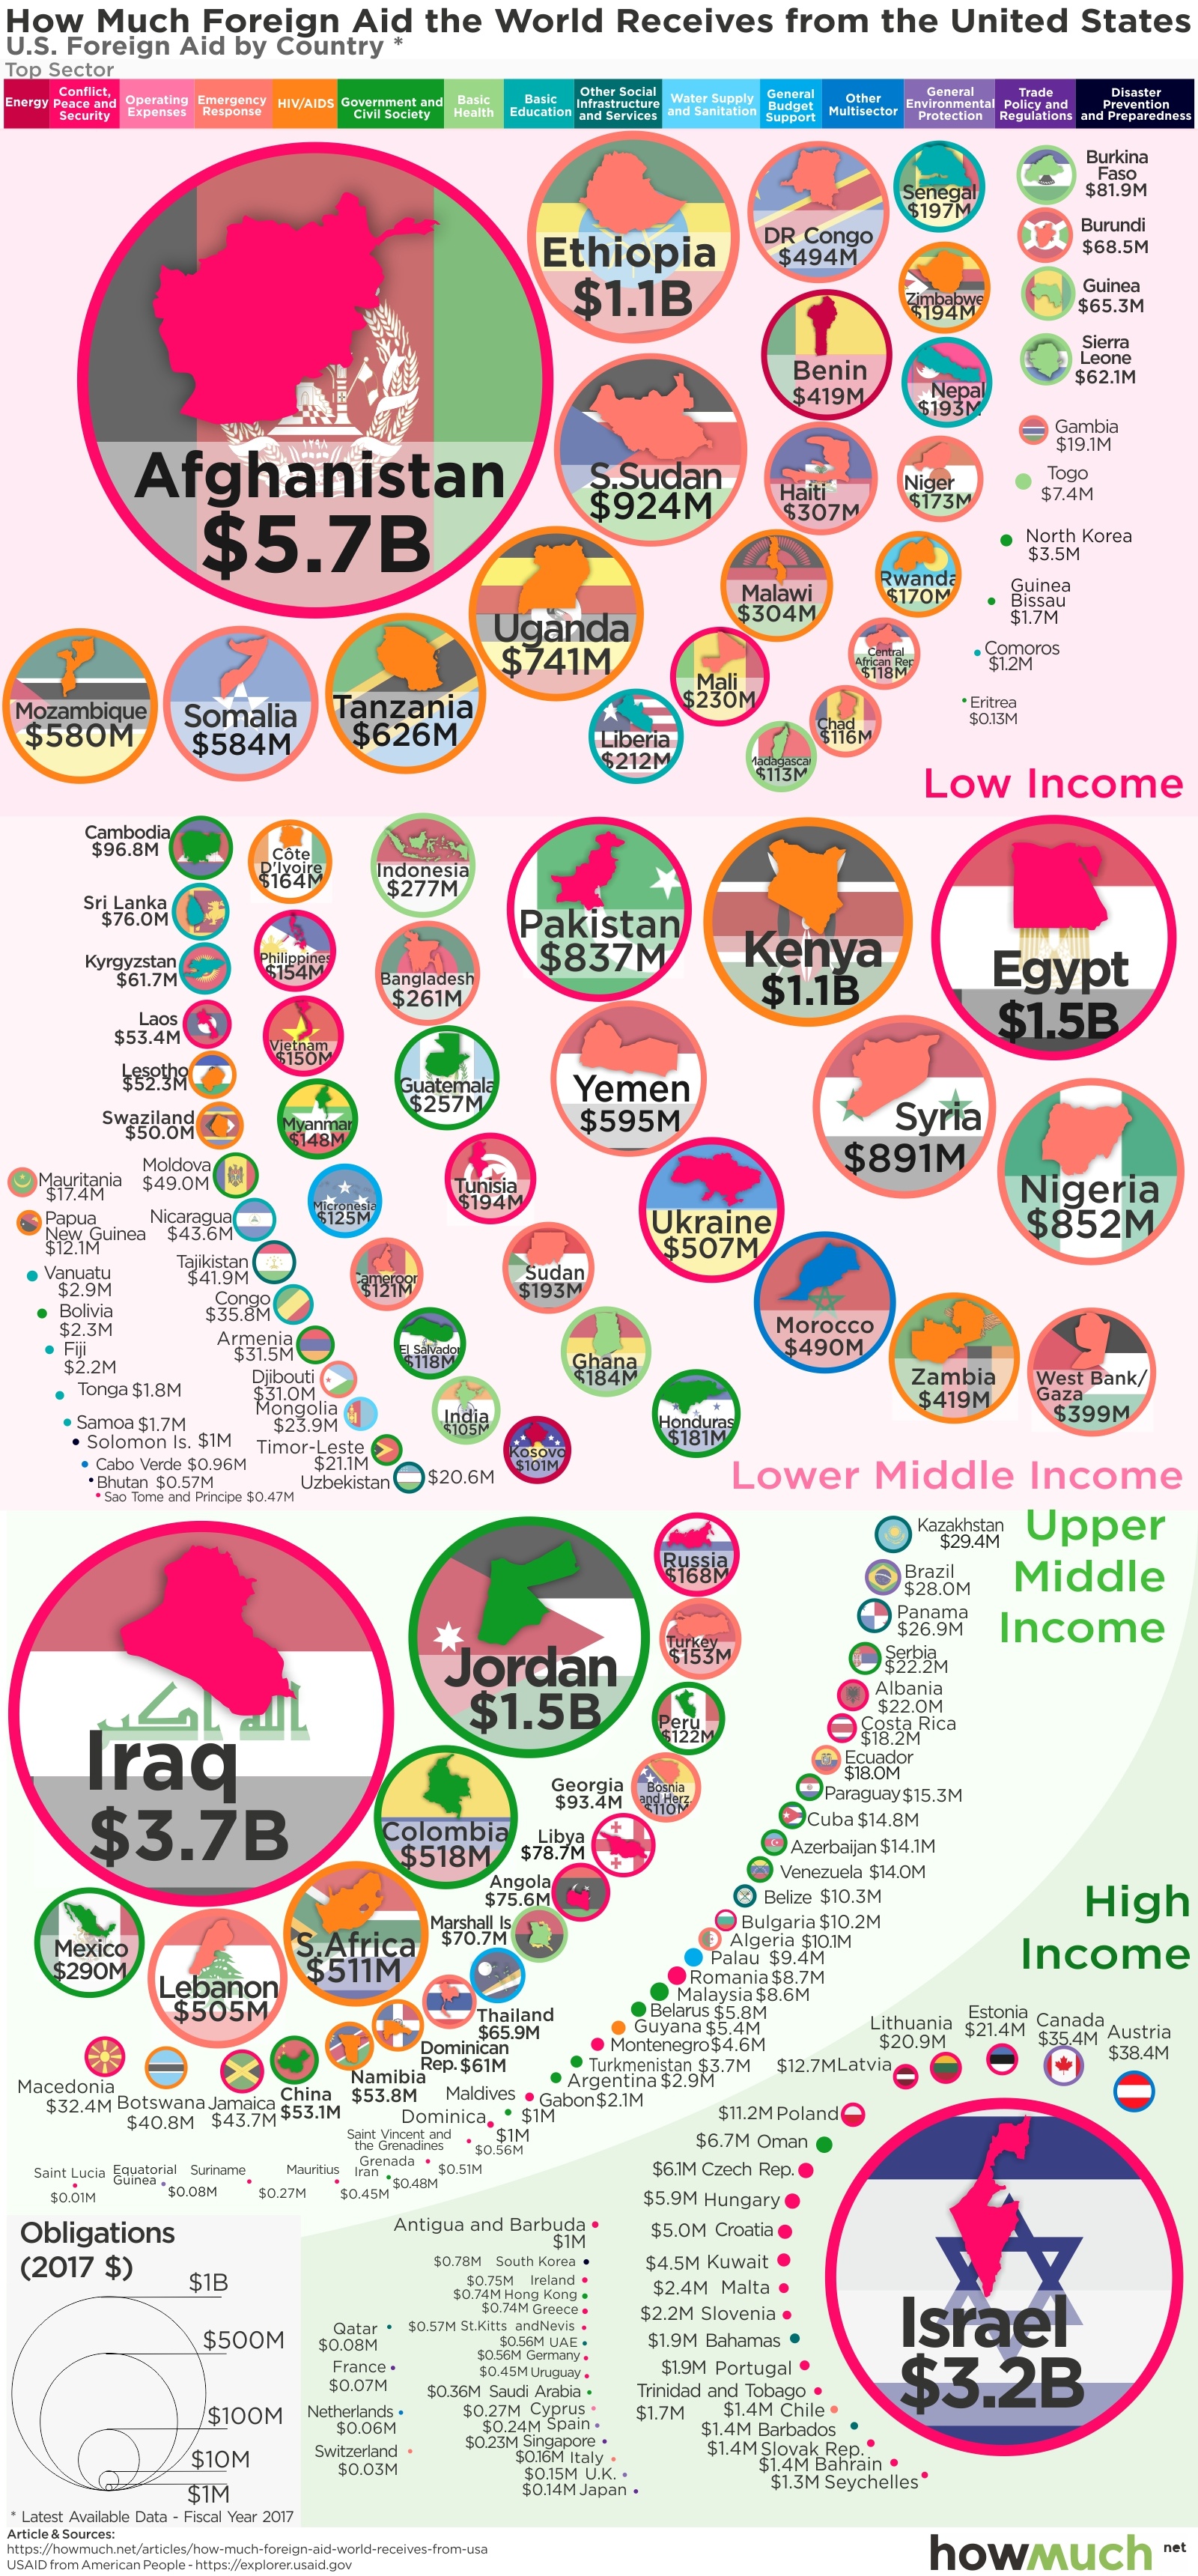
President Trump constantly threatens to cut foreign aid, but he hasn’t changed much over the last 2 years. Our visualization breaks down the countries and issues continuing to receive money during Trump's administration.

November 7th, 2018
The Economy
social-issues
Our visualization explores relationship between public perceptions of fairness and the size of every country’s economy
October 30th, 2018
The Economy
social-issues
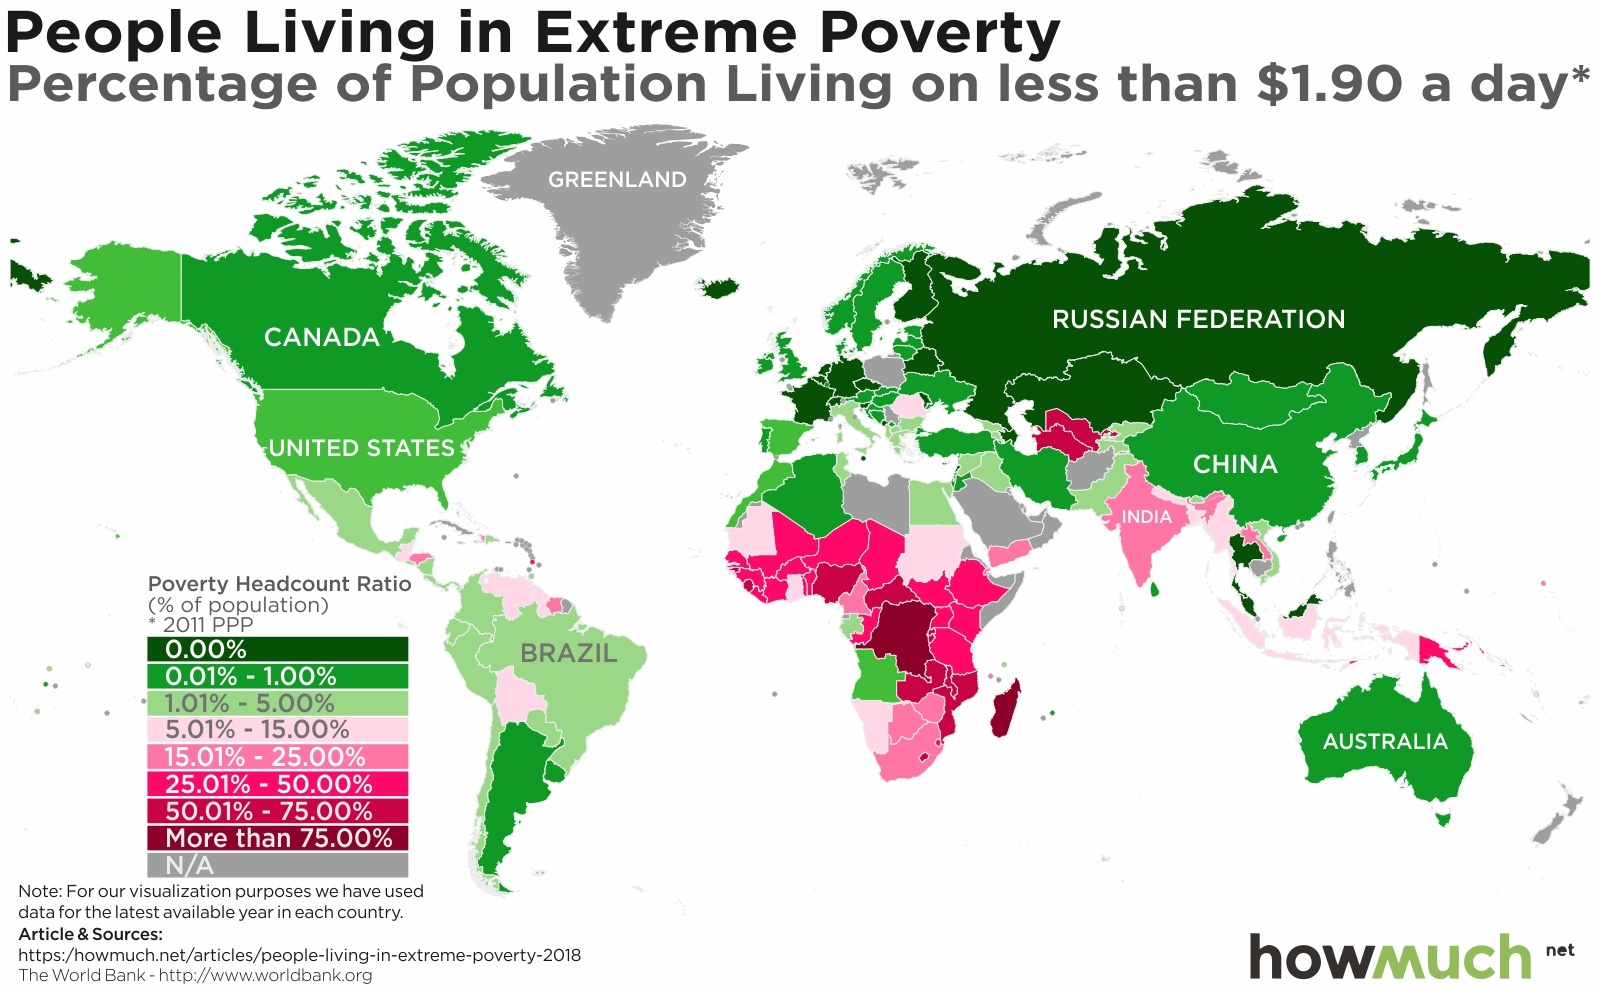
Extreme poverty is on the decline, but there are still lots of countries with crushing rates of subsistence living. Our new series of maps highlights where the have’s and have-not’s live around the world.

October 22nd, 2018
social-issues
Wealth
There’s a new Forbes 400 billionaire list, but this time with a twist. There’s a new metric that shakes things up.

October 2nd, 2018
The Economy
social-issues
Income inequality is once again a hot button political issue, but how pervasive is the problem? Our new map highlights the metro areas with the highest and lowest income ratios between the top 1% of earners and everyone else.

September 26th, 2018
Personal Finance
social-issues
Regardless of which state you live in, the top 1% of wage earners bring home substantially more money than the bottom 99%. Our new work explores the geography of income inequality across the US.

September 12th, 2018
The Economy
social-issues
Natural disasters are always in the news, but do you know which ones end up causing the most damage? Our newest visualization explores the cumulative damage of natural disasters across the U.S. since 1980.
September 11th, 2018
social-issues
jobs
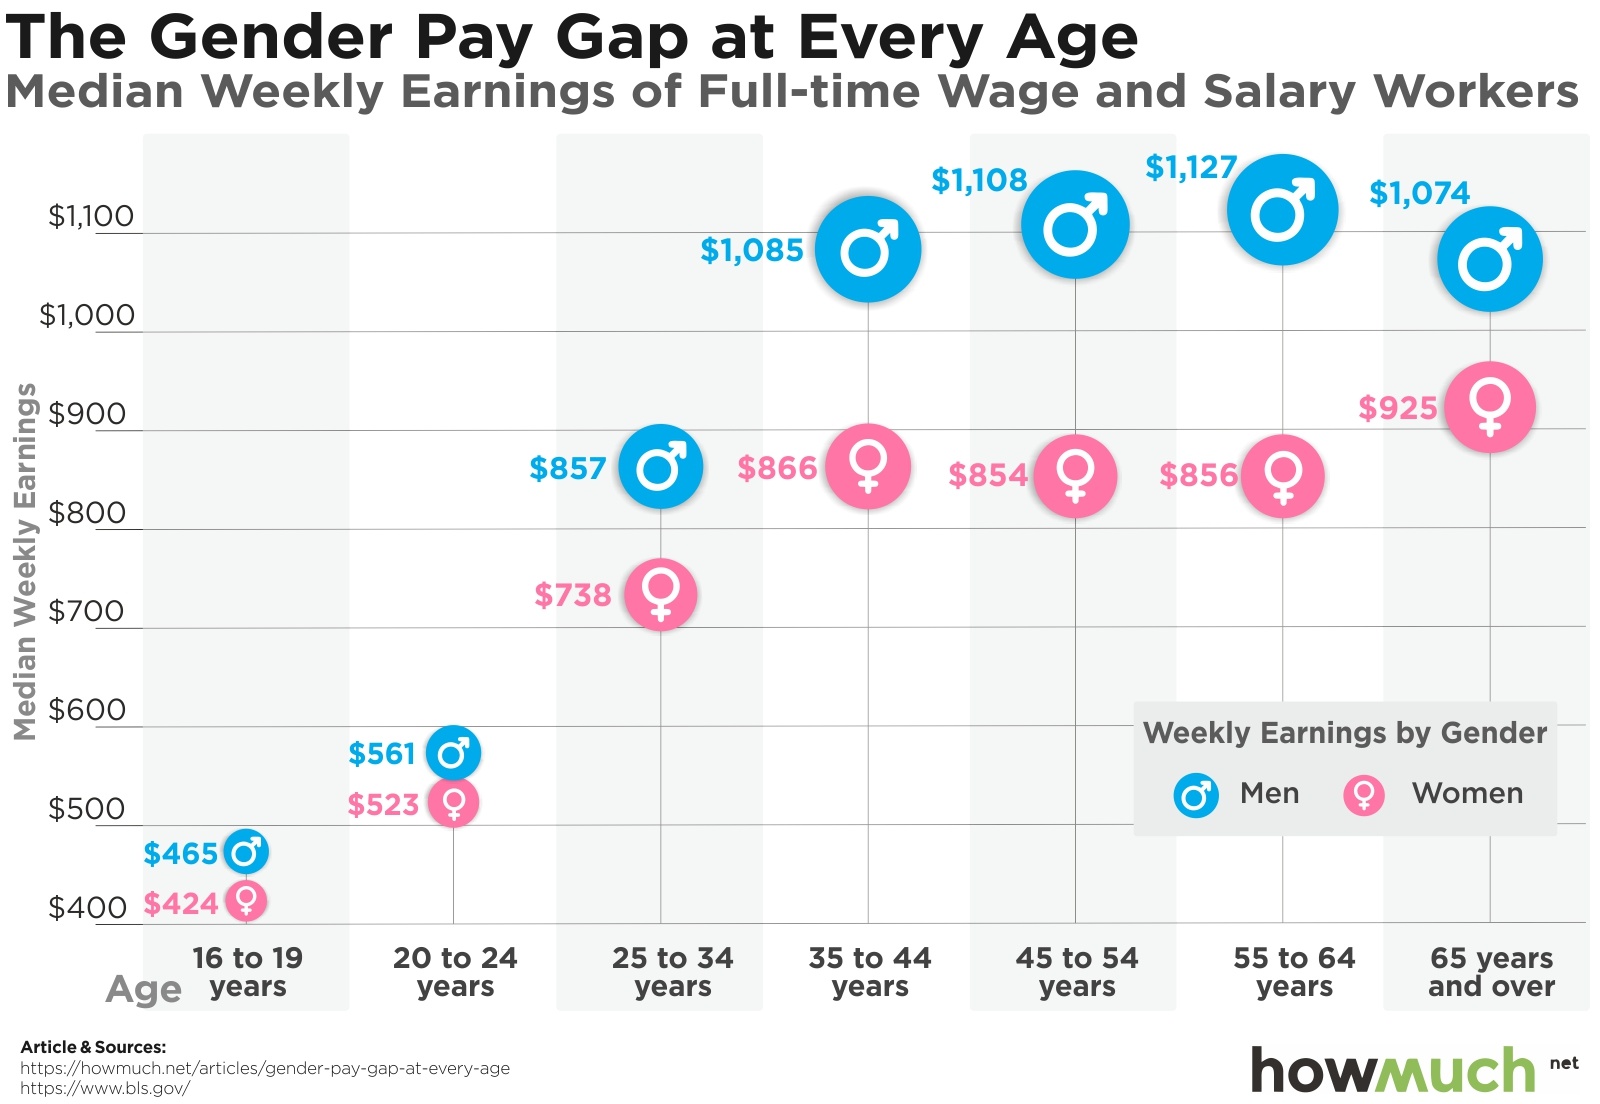
Why do men earn more money than women? Economists debate the reasons behind the gender pay gap, but our new visualization highlights the undoubtable fact that it exists for workers at every age.