
August 31st, 2018
social-issues
jobs
You know CEOs make a lot more money than average workers, but 300 times more?

August 27th, 2018
Personal Finance
social-issues
Should people get paid more just because they have more experience? Our new map breaks down median income levels among different generations for each state, and Millennials are far behind their older colleagues.

August 16th, 2018
Personal Finance
social-issues
Women make a lot less money than men, but did you know that going to college might actually make the gender pay gap worse? Our new visualization breaks down the schools with the biggest disparities.

May 29th, 2018
The Economy
social-issues
Hurricanes, heatwaves, and floods are inherently unpredictable, but do you know which ones caused the most damage? Our new visualization compares the cost of every natural disaster since 1980.

May 18th, 2018
business
social-issues
The military-industrial complex generates billions of dollars in economic activity every year, but do you know which companies make the most money selling weapons and other military hardware? Our new graph reveals the top players in the industry.

May 16th, 2018
The Economy
social-issues
The U.S. government spends more money on its military than the rest of the world, but how much more? Our new visualization ranks the top 15 countries in three different categories.

April 24th, 2018
The Economy
social-issues
Climate change is happening, but how will it impact the state where you live? Our new map reveals which places have the most to lose from rising temperatures and extreme weather events.
April 23rd, 2018
The Economy
social-issues
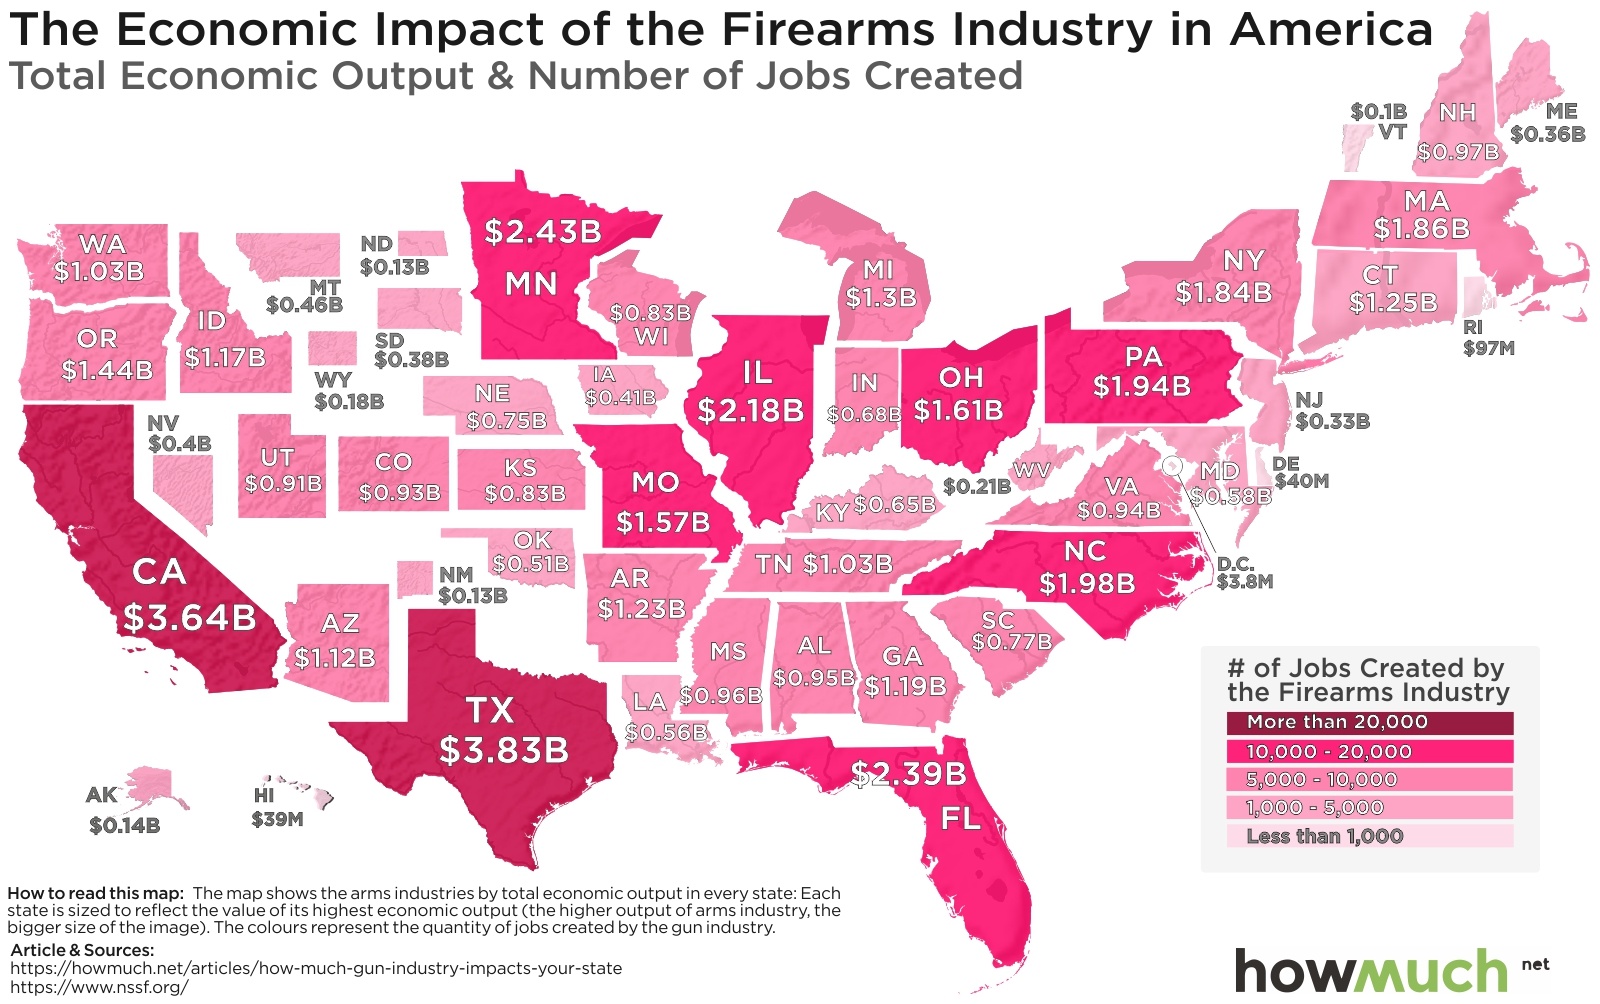
An overlooked aspect of the gun debate is how much the industry contributes to the economy. Our new map illustrates which states depend on gun manufacturers and shooting ranges for jobs and economic output.
March 27th, 2018
The Economy
social-issues
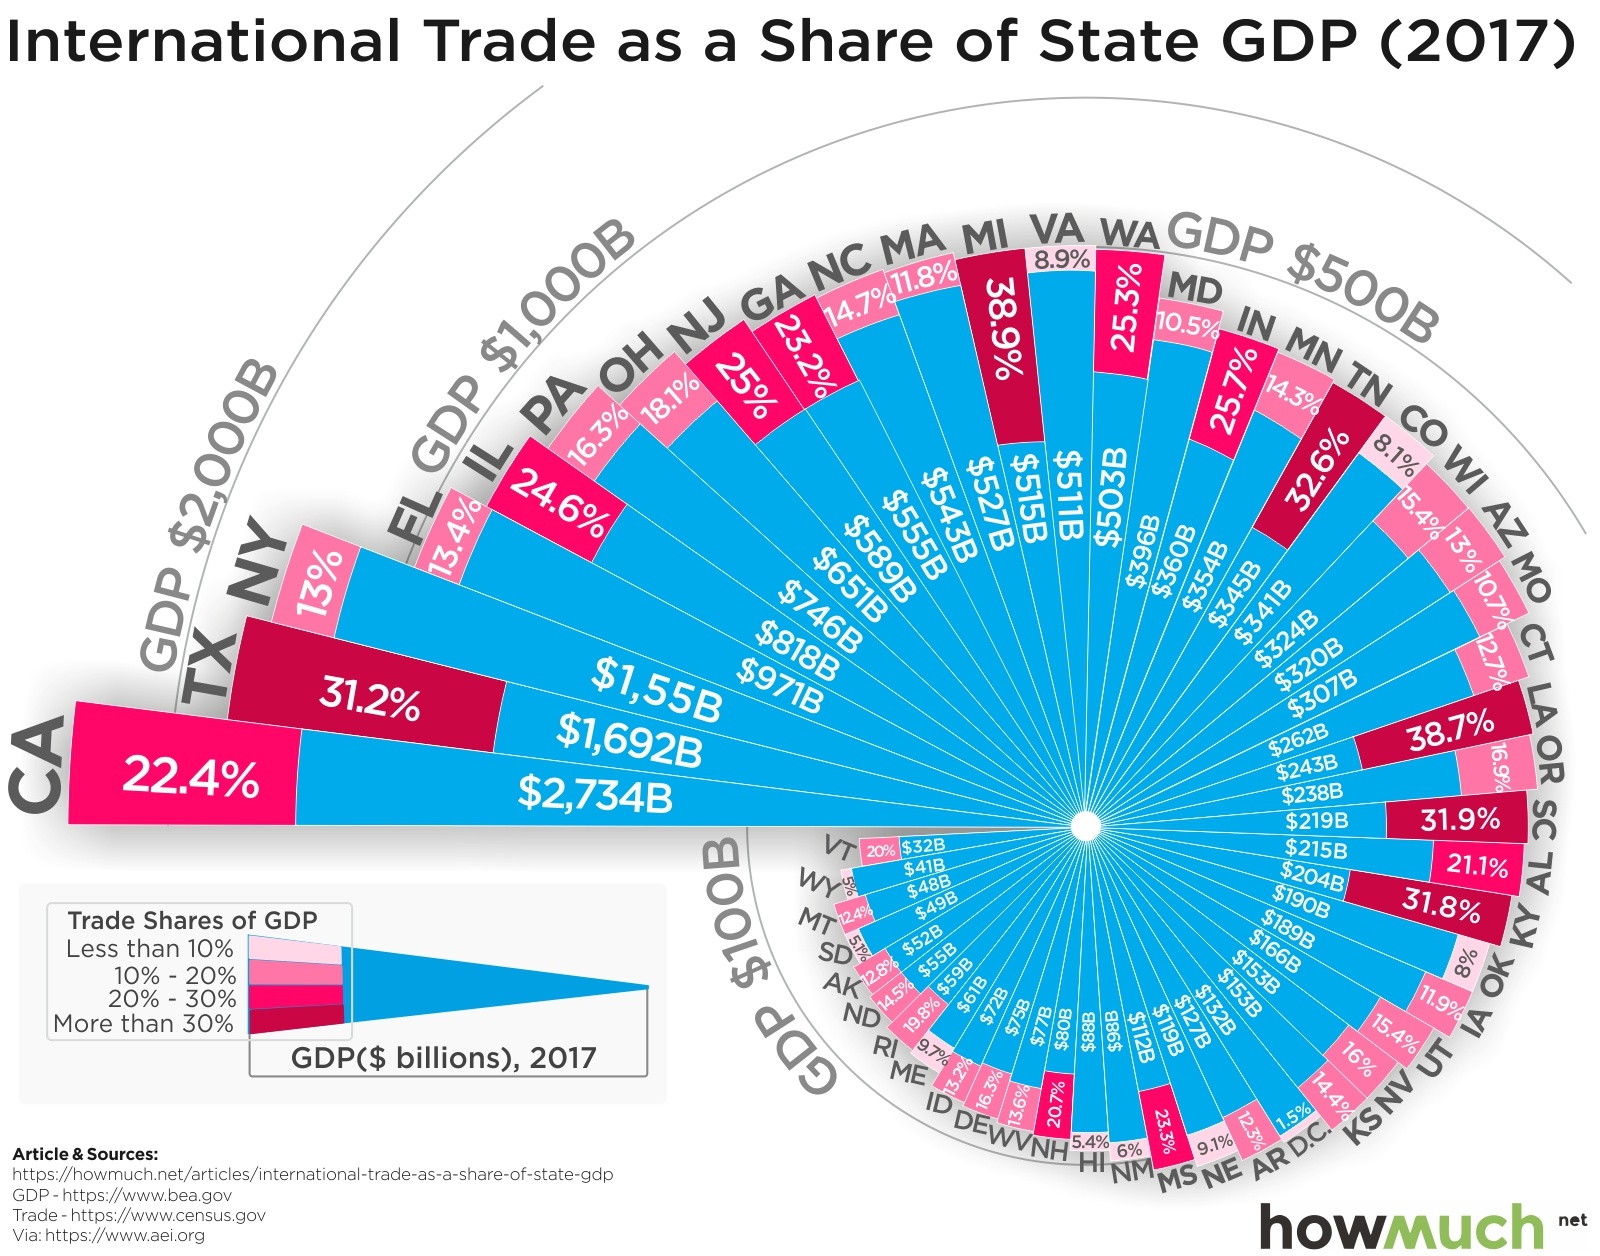
International trade is dominating the headlines, but how important is it to the broader economy? Our new graph breaks down how much each state’s GDP comes from importing and exporting goods.
March 16th, 2018
social-issues
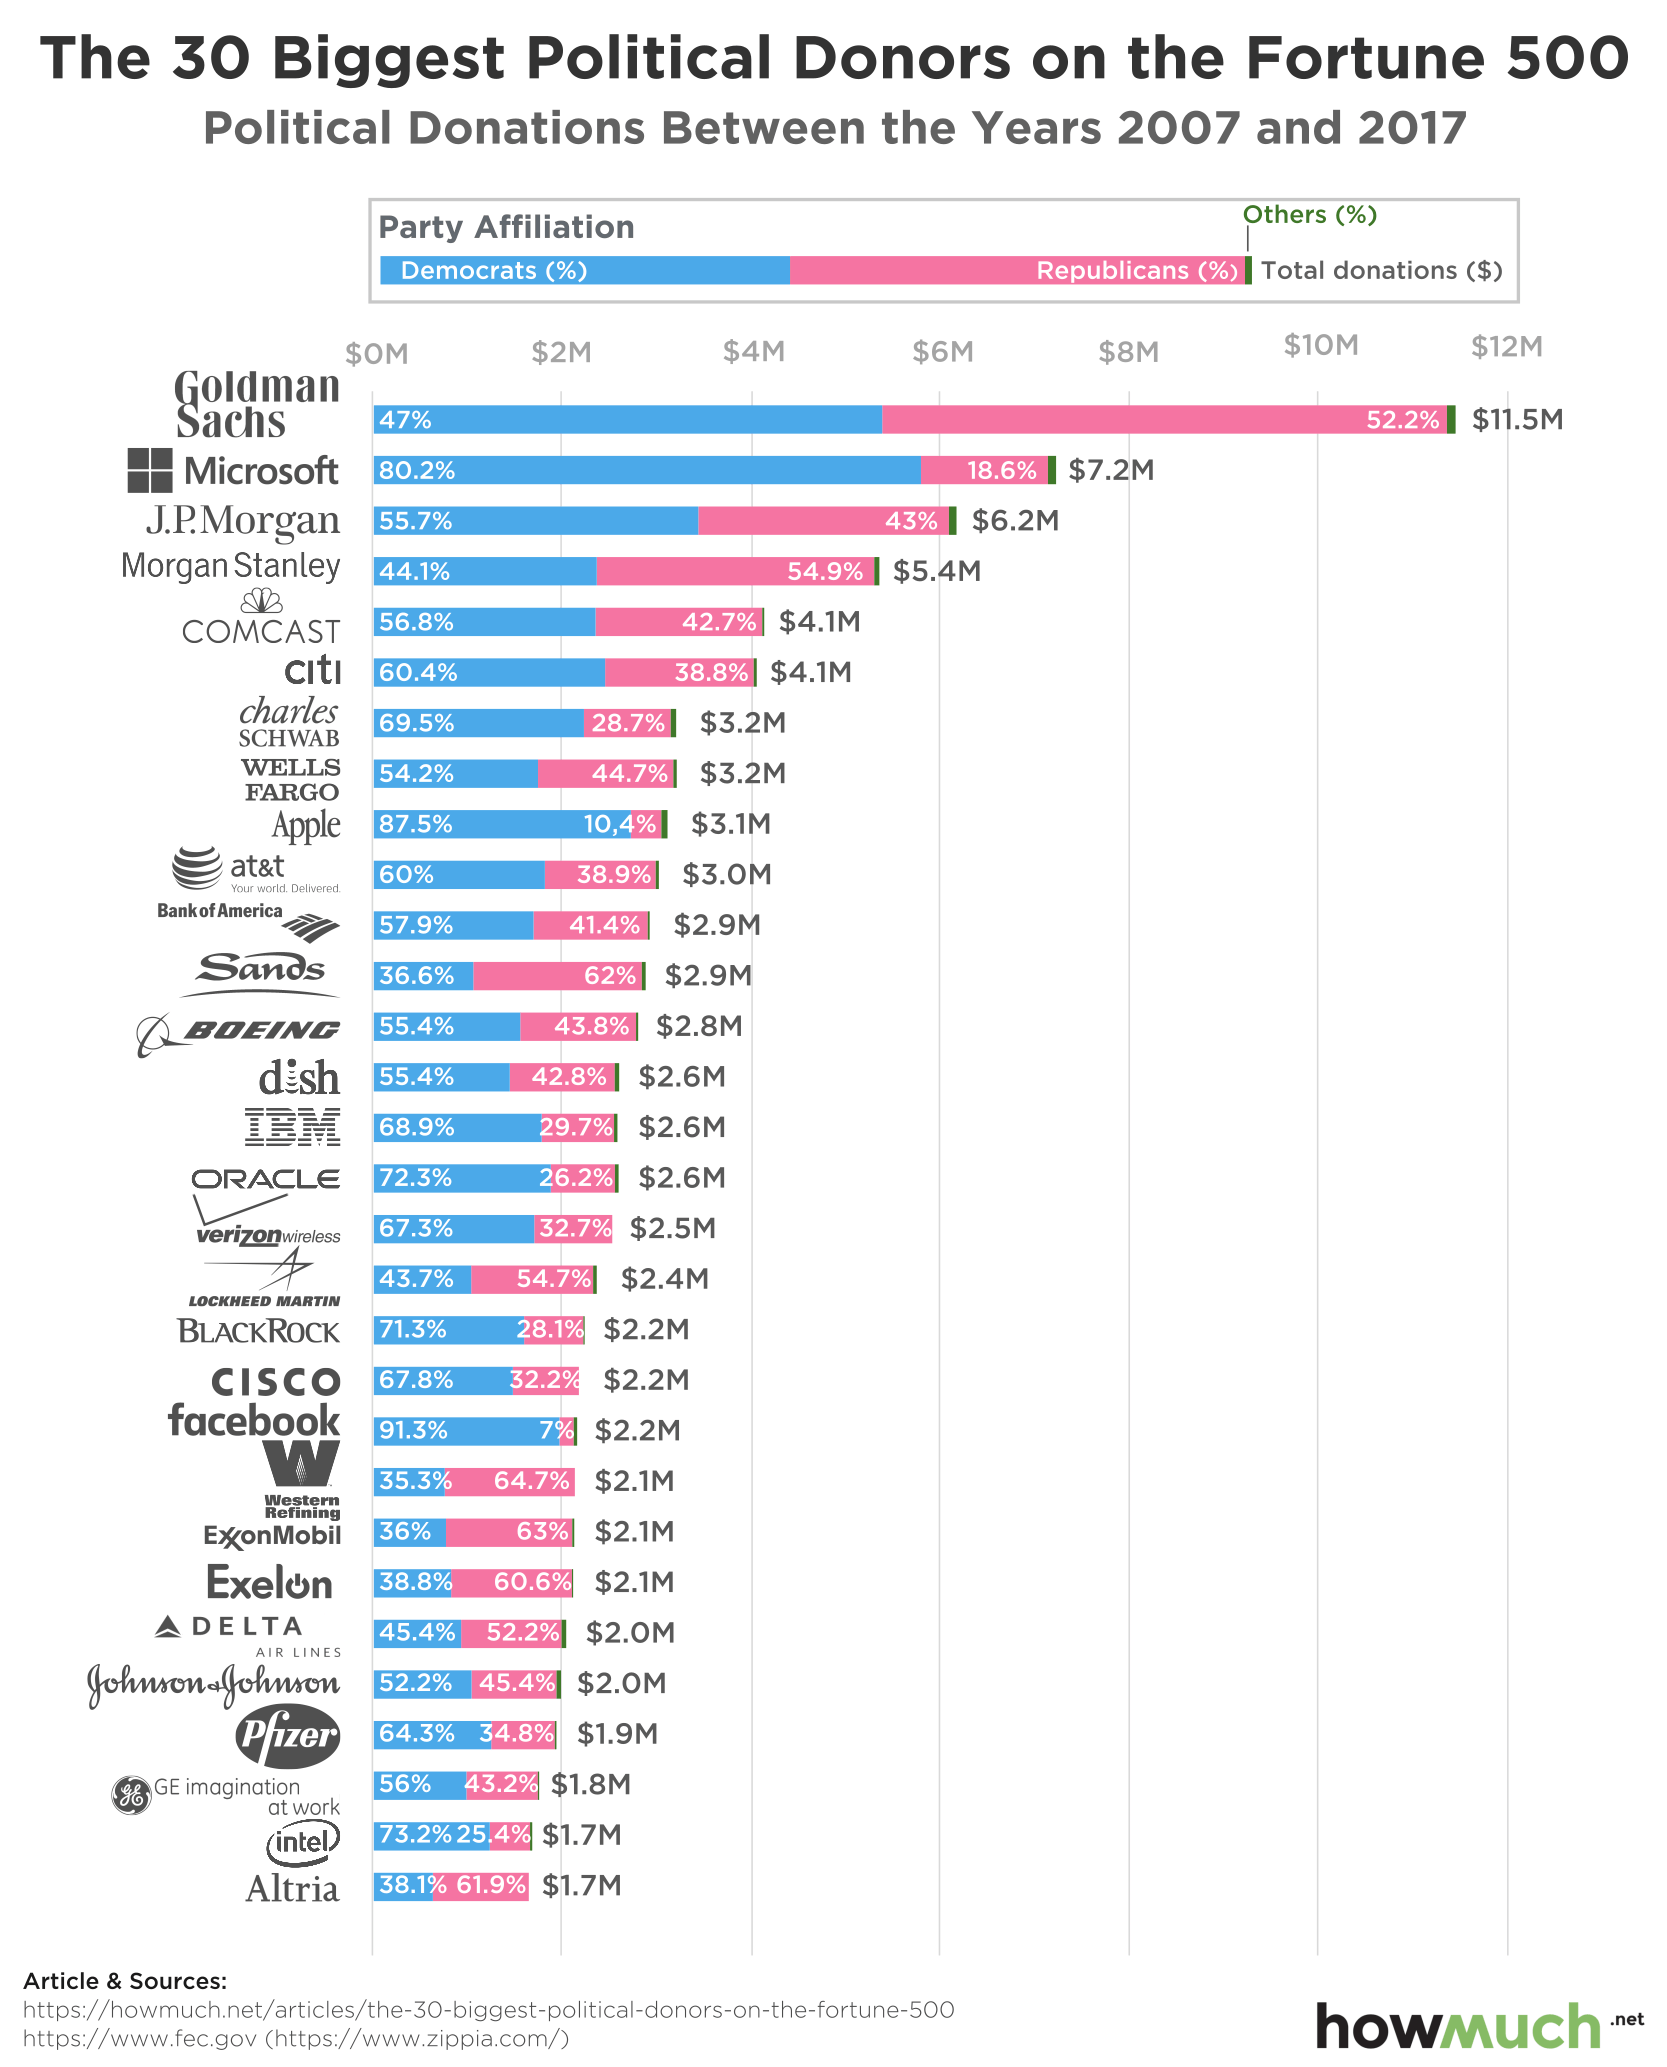
A variety of large companies have spent billions of dollars getting politicians elected over the past decade, but have Democrats or Republicans benefited the most? Our new graph breaks down the Fortune 500’s most politically active companies in terms of campaign contributions.