
August 6th, 2019
social-issues
Global military spending continues to increase, but just how much are countries around the world spending on their militaries? Let’s see what the numbers tell us

July 16th, 2019
The Economy
social-issues
The cost of U.S. immigration enforcement and border security continue to rise steeply. We look at the trends since the early 1990s

July 1st, 2019
Personal Finance
social-issues
When someone loses his/her job, some states are more generous with unemployment benefits than others.

June 12th, 2019
social-issues
How much do life expectancy and healthcare expenditures vary across countries? The short answer--a lot

May 29th, 2019
social-issues
Prescription drug spending in the United States continues to increase alongside the opioid prescription rates. Take a look at these figures to better understand which states have been hit hardest by the U.S. drug epidemic.
May 27th, 2019
The Economy
social-issues
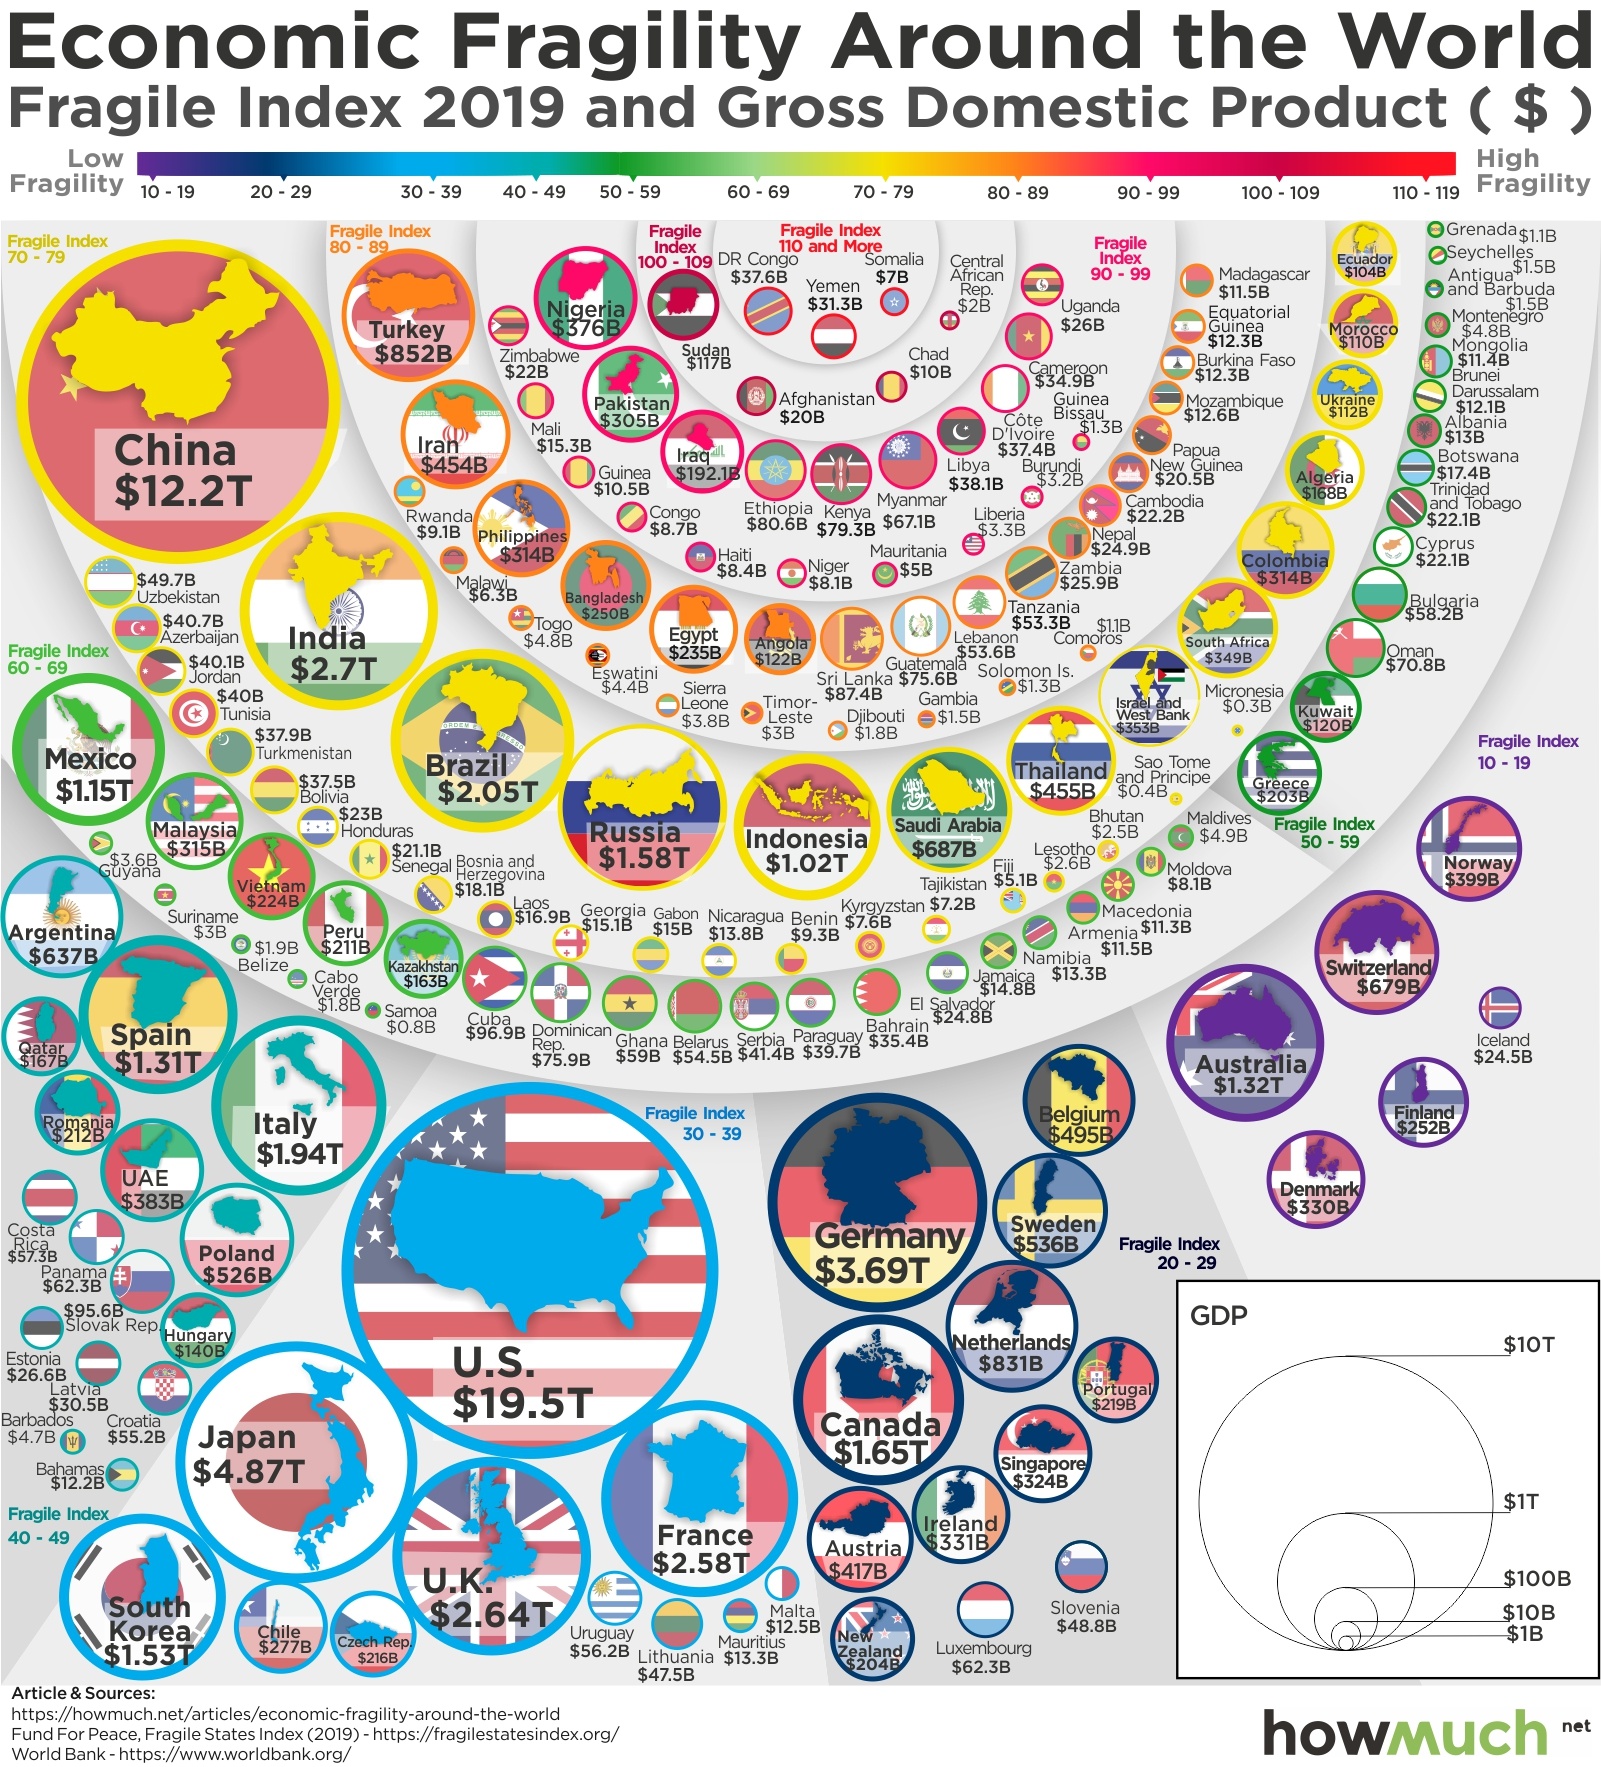
Stability is key for any countries’ progress. The Fund For Peace, a US based NGO analyzes immense data and stack ranks 174 countries from the least stable to most stable. Curious to know how stable your country is?

April 9th, 2019
Personal Finance
social-issues
Have you ever noticed how prices for some goods differ based on whether they are marketed for men or women? If so, you have encountered an economic phenomenon known as the “pink tax”

April 1st, 2019
Personal Finance
social-issues
How much money do you need to make to be considered at risk of poverty? In some countries, the threshold is higher than you might think

February 21st, 2019
The Economy
social-issues
President Trump frequently criticizes how little money other countries spend on global institutions like the UN. Our visualization lets you compare American financial support for the UN with the rest of the world

February 18th, 2019
Personal Finance
social-issues
The simple truth behind the gender pay gap is it gets worse as workers get older. Our visualization shows how men earn more than women at every age, but just as workers settle into a career, the gap explodes