
March 16th, 2020
business
The Economy
social-issues
investments
The coronavirus is wreaking havoc on global markets. This visualization shows the extent of the damage to several key American companies.

March 12th, 2020
Personal Finance
social-issues
debt
monetary-policy
From coast to coast, consumer debt in America continues to grow.

March 5th, 2020
business
The Economy
social-issues
investments
Wealth
Have you ever thought about how much money it would take to be the wealthiest person where you live? Our map breaks down the wealthiest person in each state.

February 27th, 2020
business
The Economy
social-issues
monetary-policy
Wealth
February 2020 five visuals we wish we had created because they are that good!

February 19th, 2020
Personal Finance
Real Estate
social-issues
What are Americans paying in renters insurance, and will these numbers change with the housing boom?

February 10th, 2020
Personal Finance
taxes
social-issues
Ever wondered how your state’s tax system compares to others? Here’s an overview of the U.S. state tax system based on seven visualizations.

January 21st, 2020
The Economy
social-issues
trade
With the U.S. and Iran hitting the newswire, how do the two stack up economically, militarily, and population-wise? Our visualization highlights key metrics to show the size of the two countries side by side
January 16th, 2020
business
The Economy
social-issues
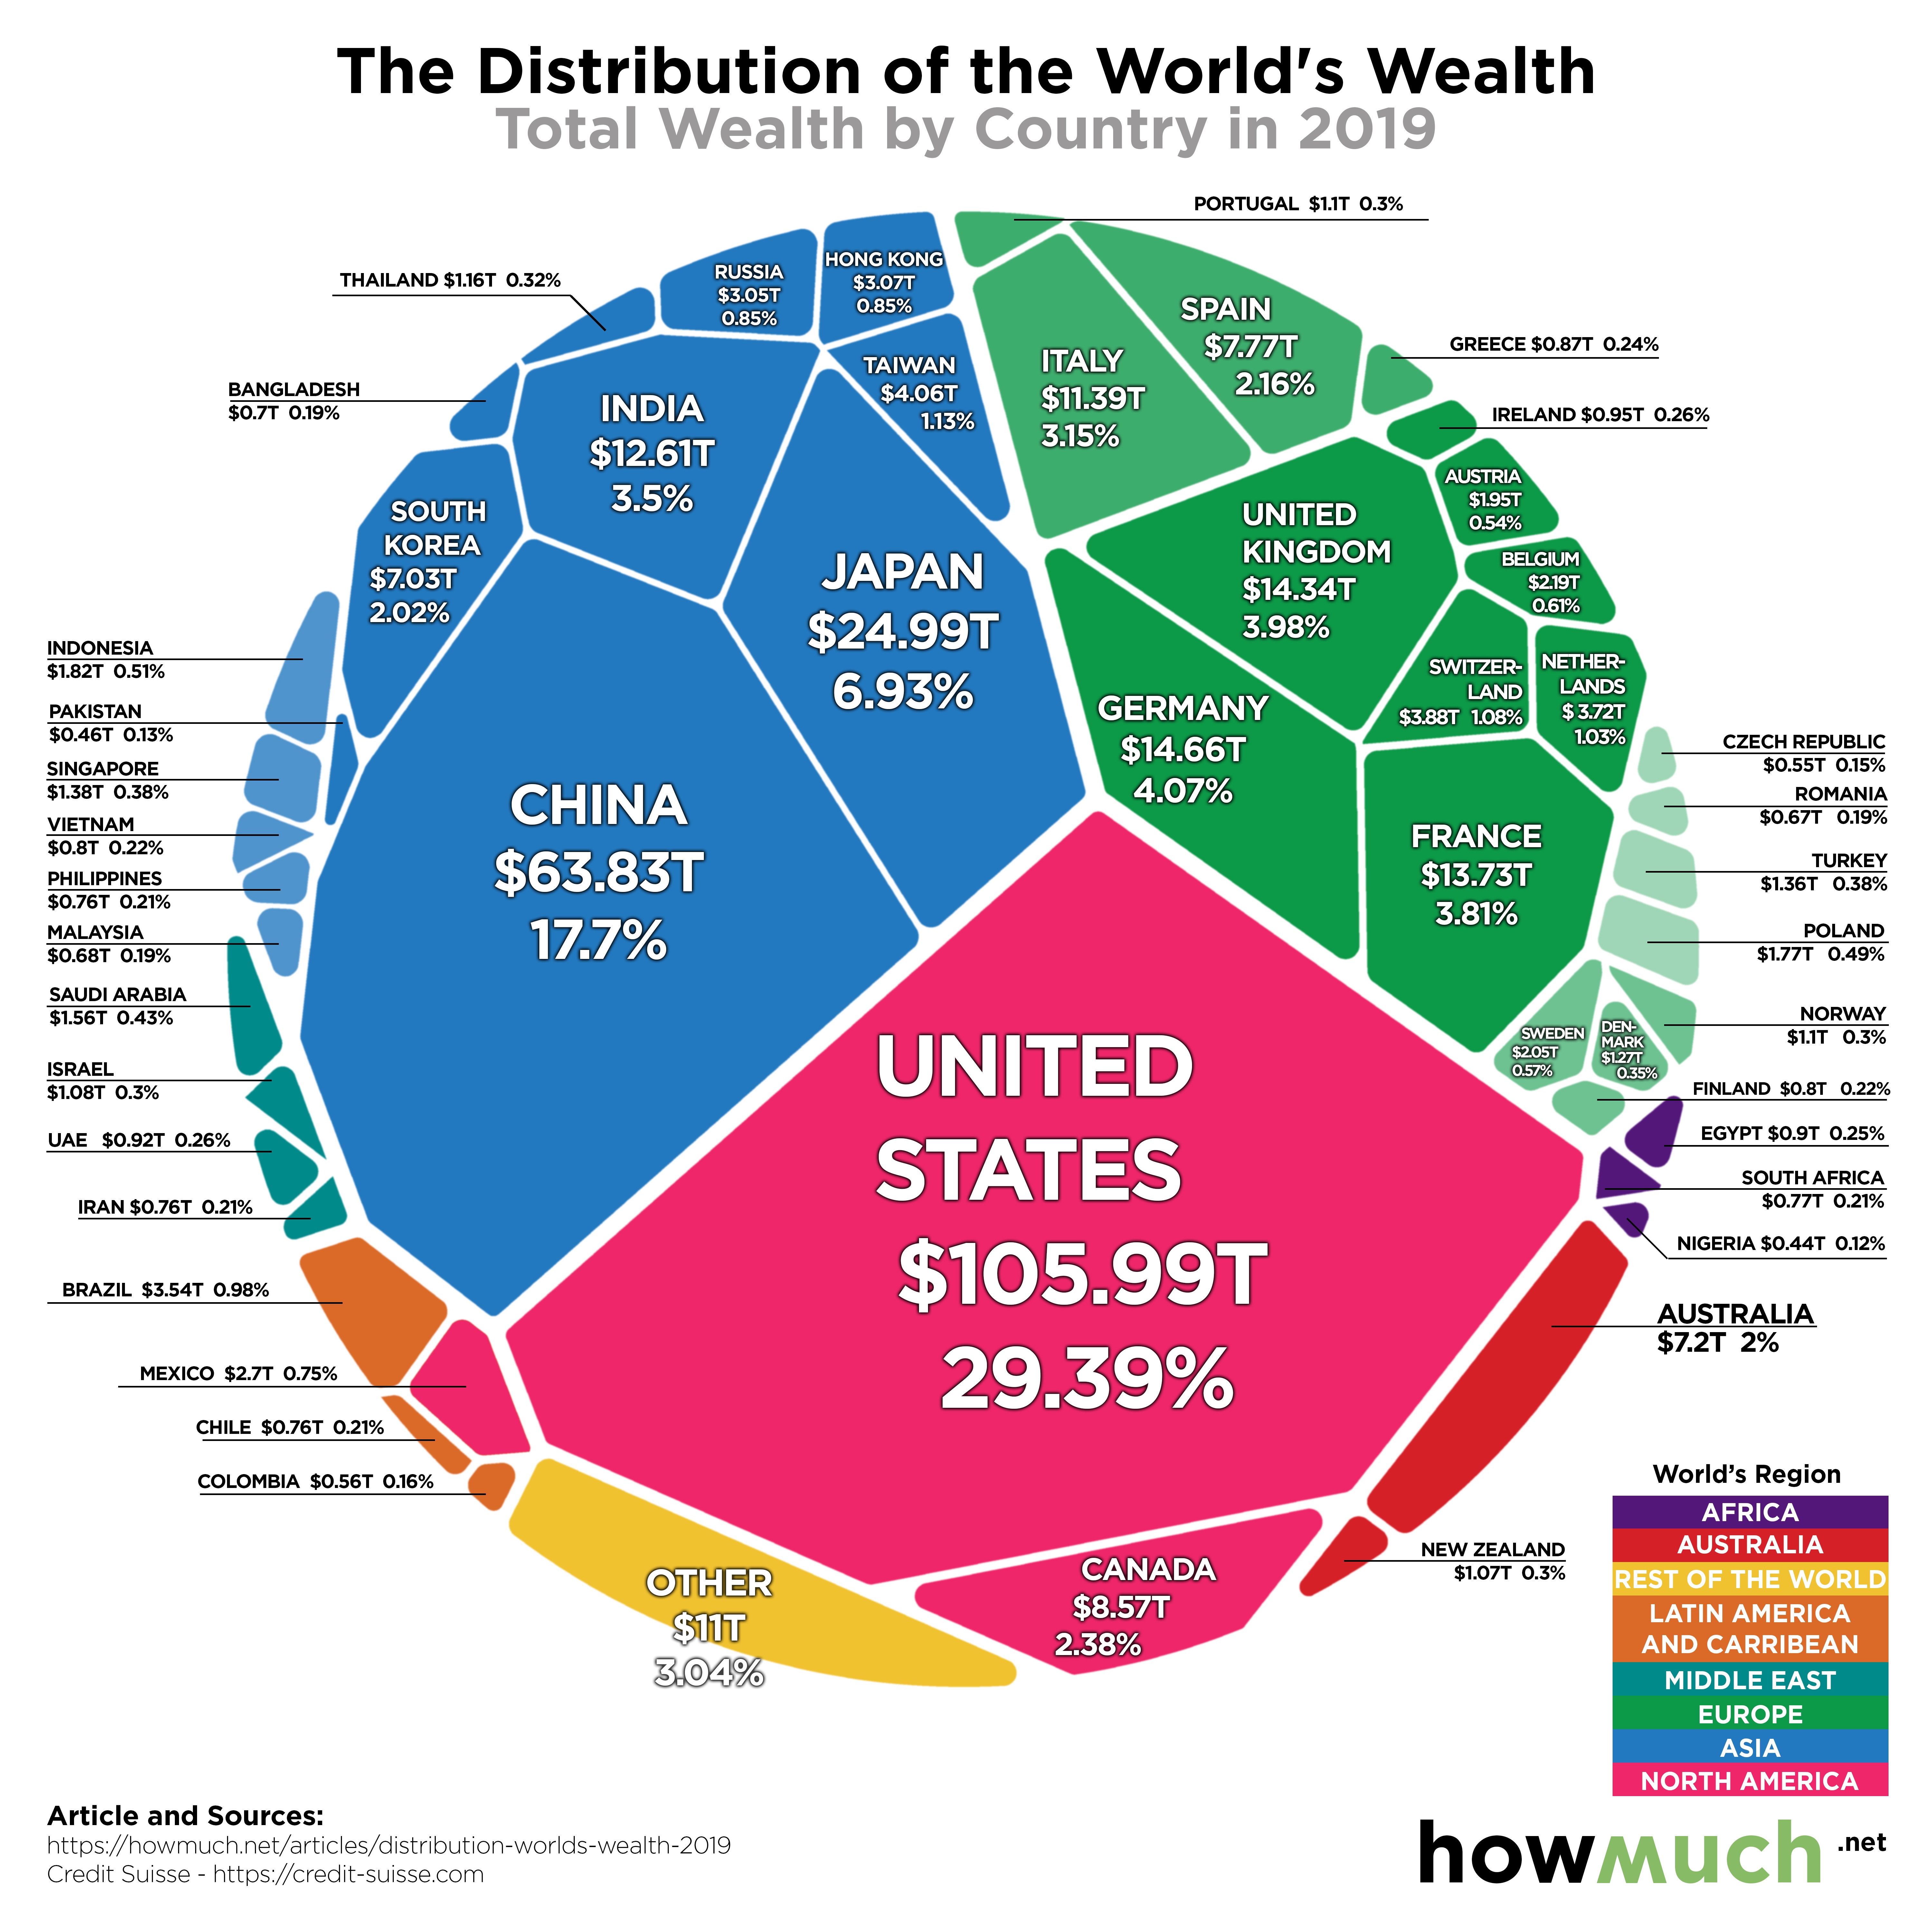
Wealth
The world has a net worth of $360T. The U.S. economy continues to dominate given its sheer size, Asia and Europe are not that far behind.

January 14th, 2020
Personal Finance
The Economy
social-issues
monetary-policy
Electric cars are good for the environment, but they can be bad for your budget. This map breaks down how much it costs and how popular it is to own an electric vehicle.
January 9th, 2020
The Economy
social-issues
monetary-policy
Wealth
jobs
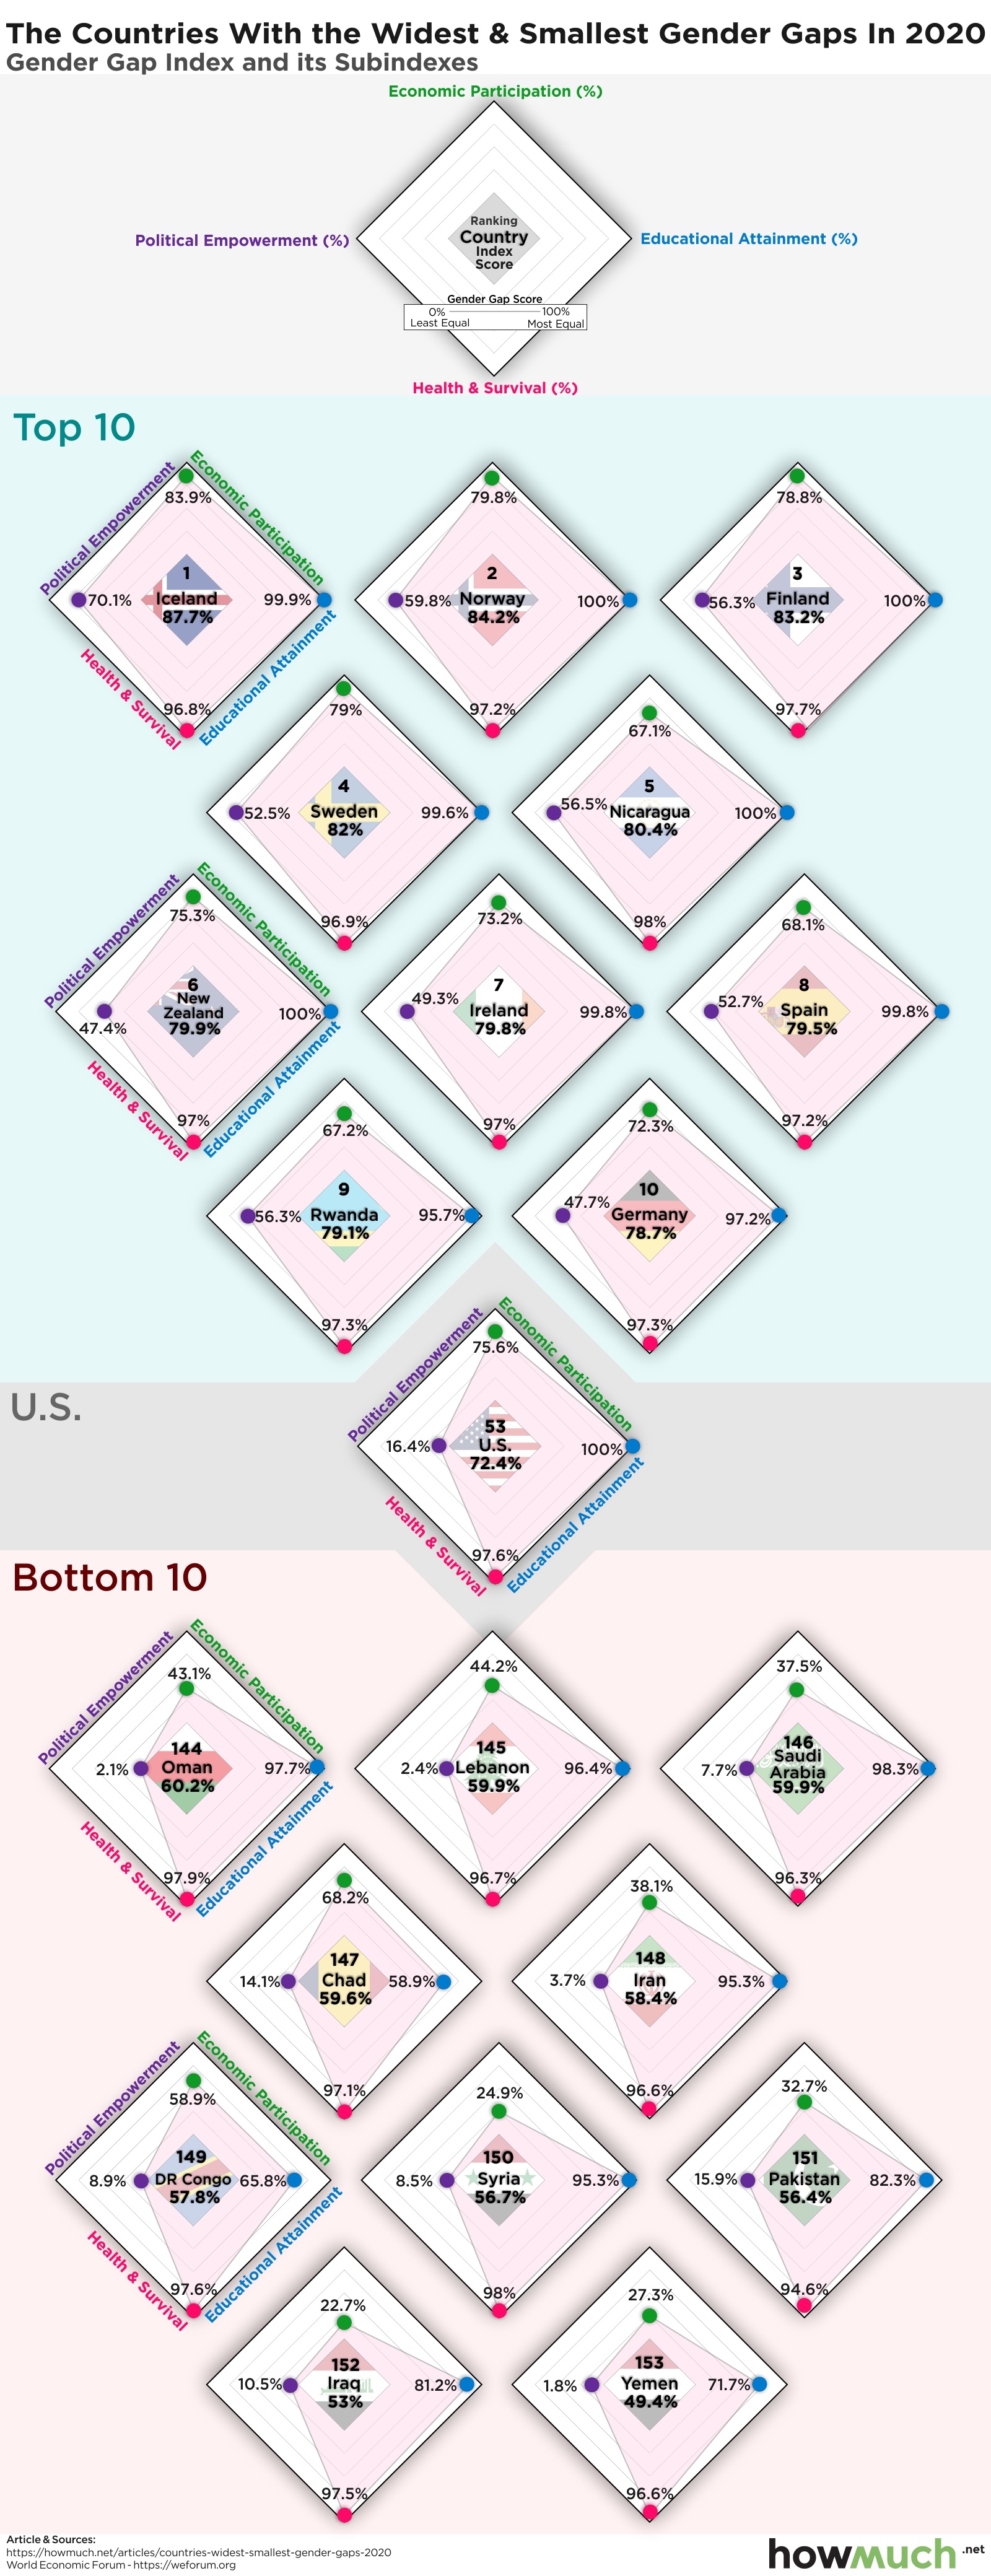
Which countries around the world lead the way in closing the gender gap and are they achieving their goals on all fronts? Our visualization lays out all the key elements for the top scorers.