
April 20th, 2020
Personal Finance
The Economy
Wealth
The number of billionaires in the world changes frequently. Here’s the most recent tally of billionaires around the world -- as well as the countries where they live.

April 15th, 2020
business
The Economy
investments
Wealth
Who is the wealthiest person by country around the world?
April 14th, 2020
Personal Finance
business
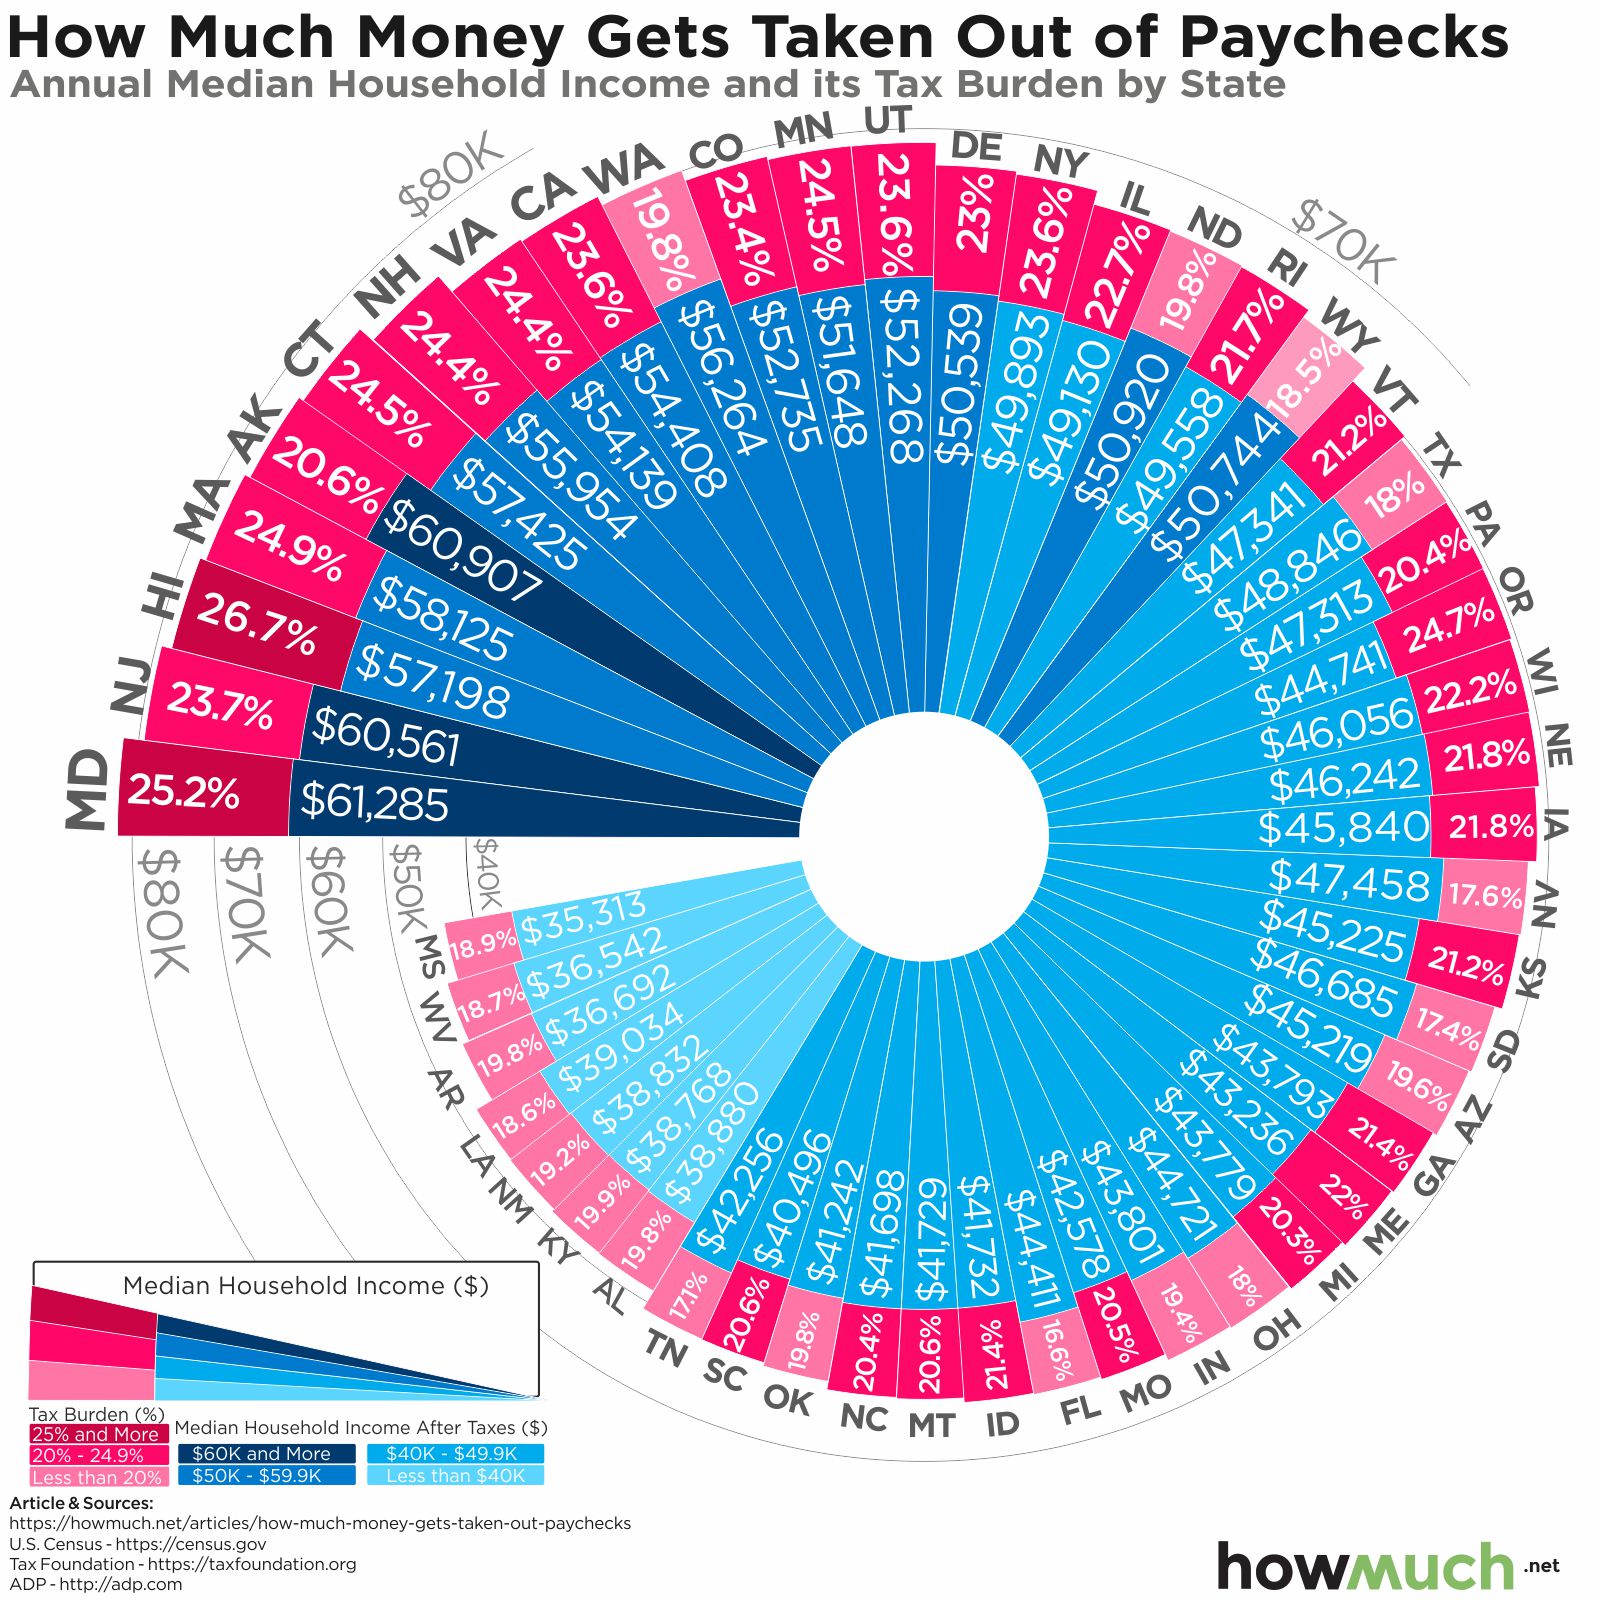
taxes
This visualization breaks down how much workers are paying in taxes, demonstrating how the tax burden wildly varies around the country.

April 9th, 2020
business
The Economy
social-issues
What’s in store for the world’s largest manufacturing producers?

April 8th, 2020
Personal Finance
The Economy
social-issues
monetary-policy
What stimulus plans have been implemented for the world’s largest economies due to the coronavirus?

April 6th, 2020
Personal Finance
The Economy
social-issues
monetary-policy
Wealth
The coronavirus crisis has thrust issues of economic inequality into the spotlight. But what did economic inequality, as measured by the distribution of wages, look like before the outbreak?

March 30th, 2020
Personal Finance
The Economy
social-issues
monetary-policy
The U.S. government is spending $2 trillion to stimulate the economy and fight the coronavirus. Here’s where the money is going.

March 30th, 2020
The Economy
investments
Exploring the sources of demand for this safe haven investment.

March 30th, 2020
The Economy
social-issues
debt
This visualization charts the major events associated with an ever-climbing level of national debt.

March 26th, 2020
The Economy
taxes
social-issues
monetary-policy
With $150b approved, Congress hopes to blunt the impact to state and local governments through a direct infusion of cash. Our visualization highlights the approach taken by lawmakers to divvy up the funds.