March 10th, 2021
The Economy
debt
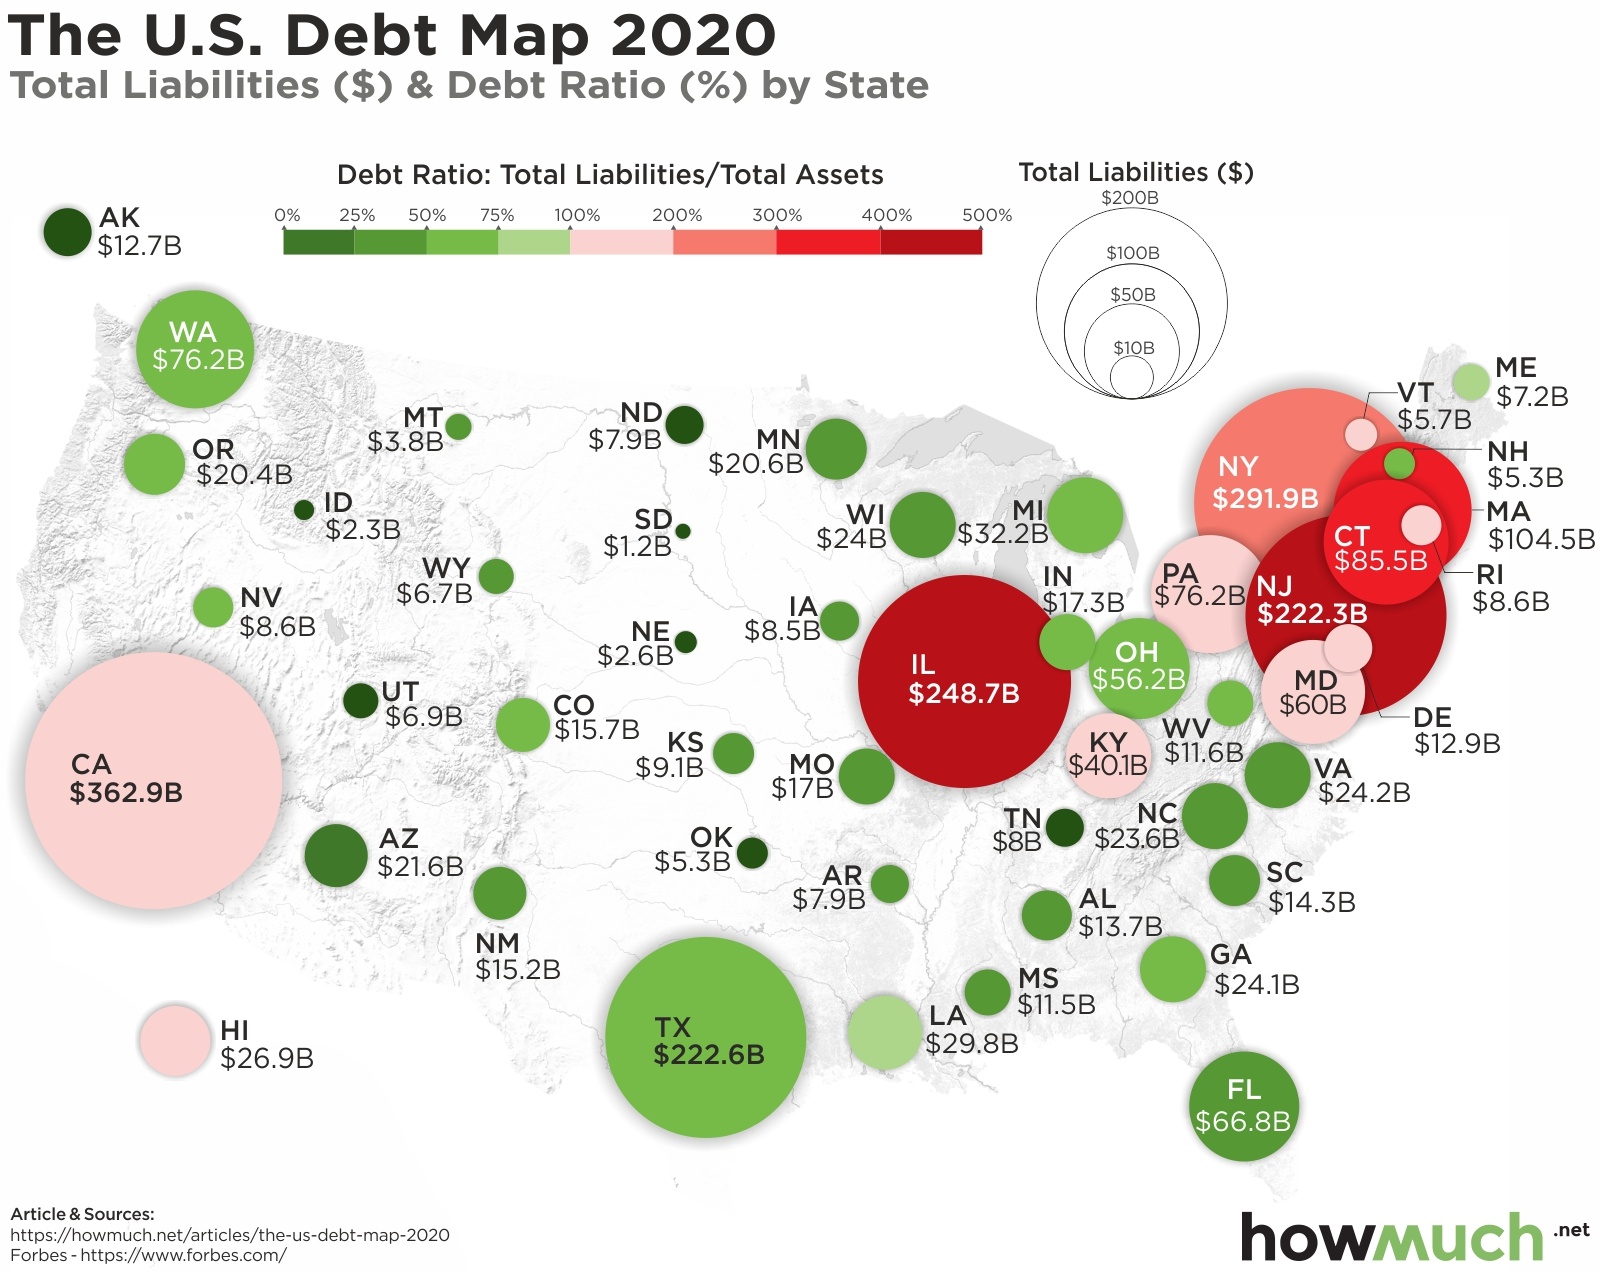
This map shows which states have the biggest problems with out-of-control debt levels, and which ones are weathering the pandemic with strong balance sheets

March 8th, 2021
The Economy
debt
Crushing student loan debt is a drag on the U.S economy. These are the schools responsible for originating the most student loans in every state around the country

March 4th, 2021
Personal Finance
social-issues
The gender wage gap refers to how men make more money than women. This visualization shows which industries have the biggest problem paying women less than men
March 3rd, 2021
The Economy
cryptocurrencies
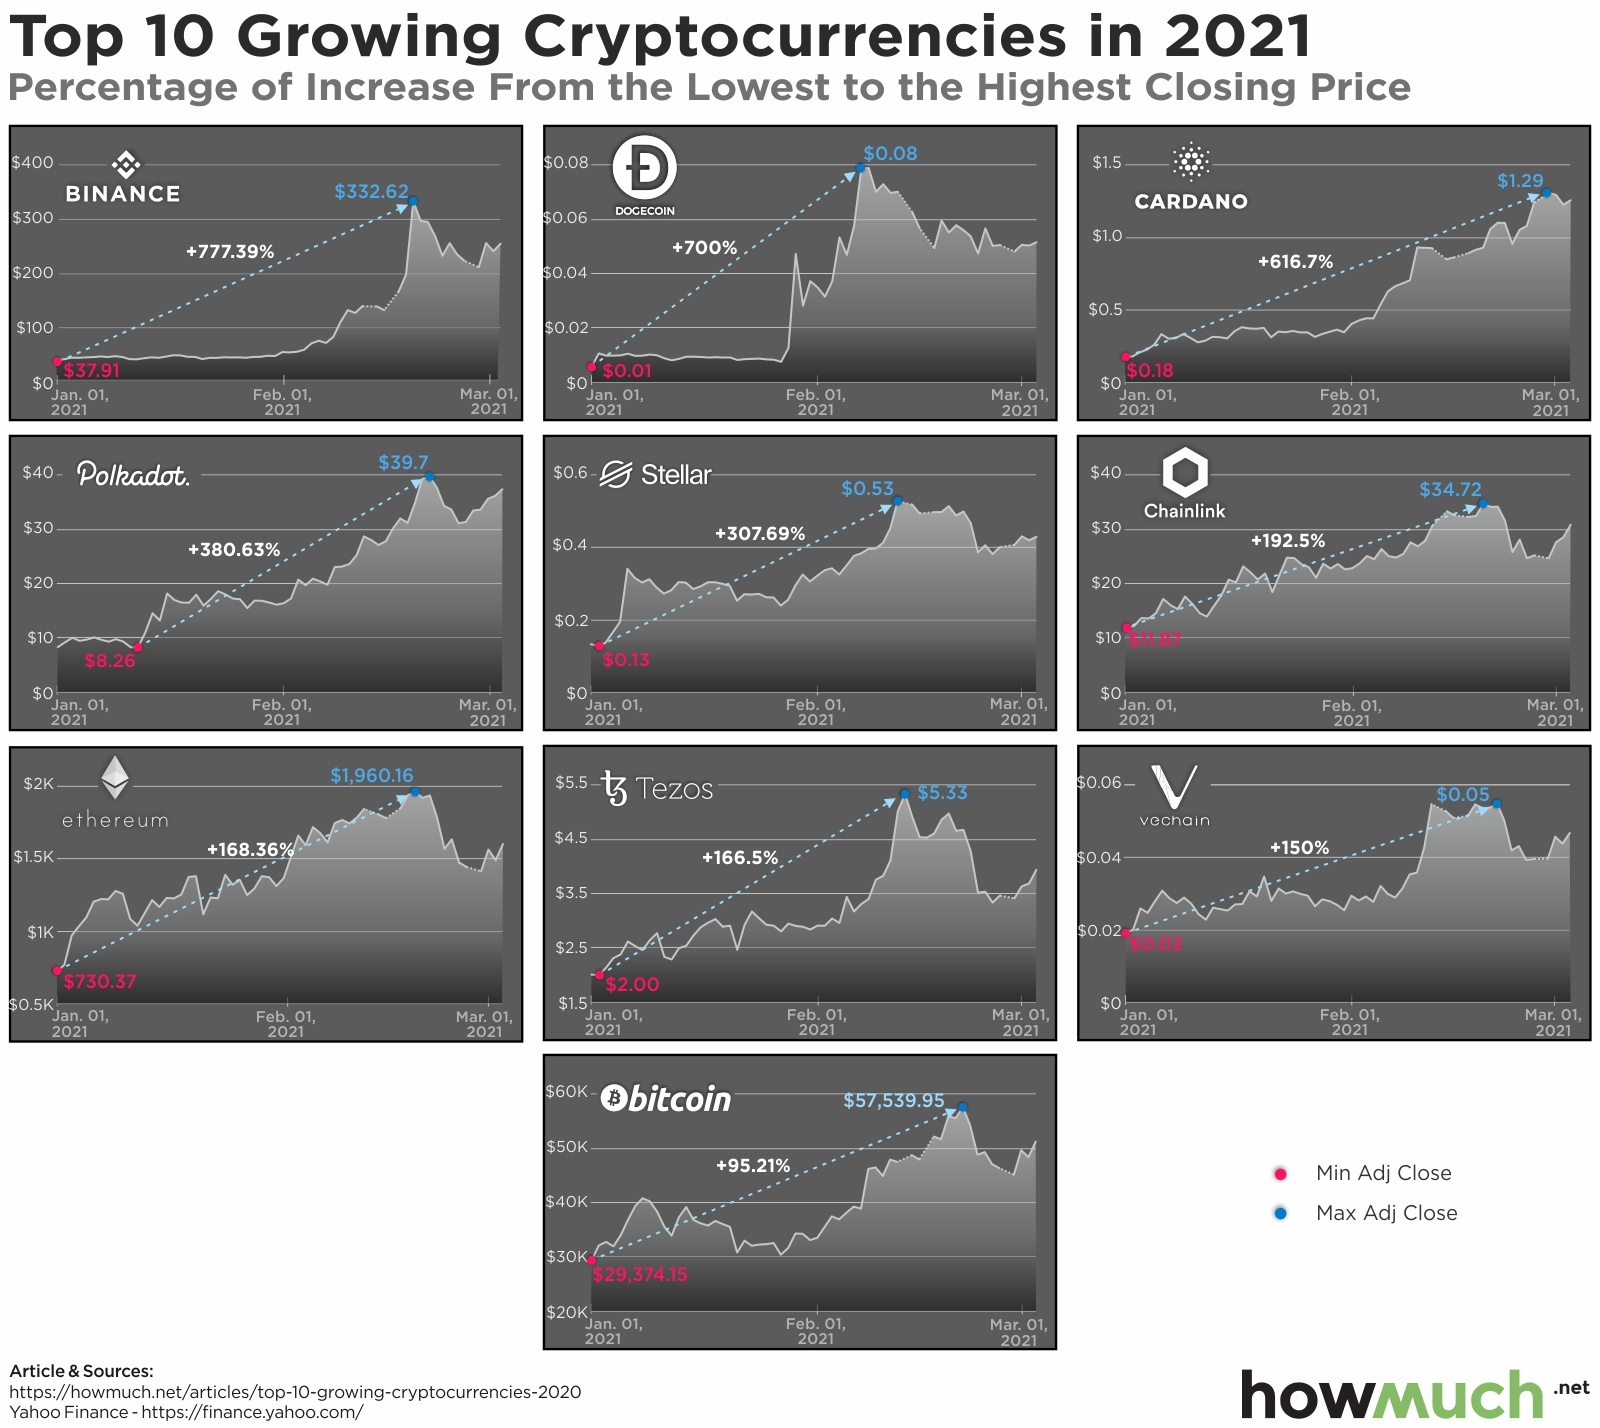
The value of many cryptocurrencies surged in 2021. We look at the top 10 by percentage gained

February 23rd, 2021
The Economy
social-issues
Wealth
Our visualization displays both the number of people and the percentage of the population living in extreme poverty for countries around the world

February 19th, 2021
The Economy
trade
Our visualization breaks down the value of U.S. imports and exports for 2020 into subcategories within goods and services

February 17th, 2021
business
The Economy
investments
U.S. airlines saw record losses in 2020. Here’s how the stock market responded

February 16th, 2021
The Economy
jobs
Our visualization illustrates the unemployment rates by metropolitan area in 2020
February 9th, 2021
business
The Economy
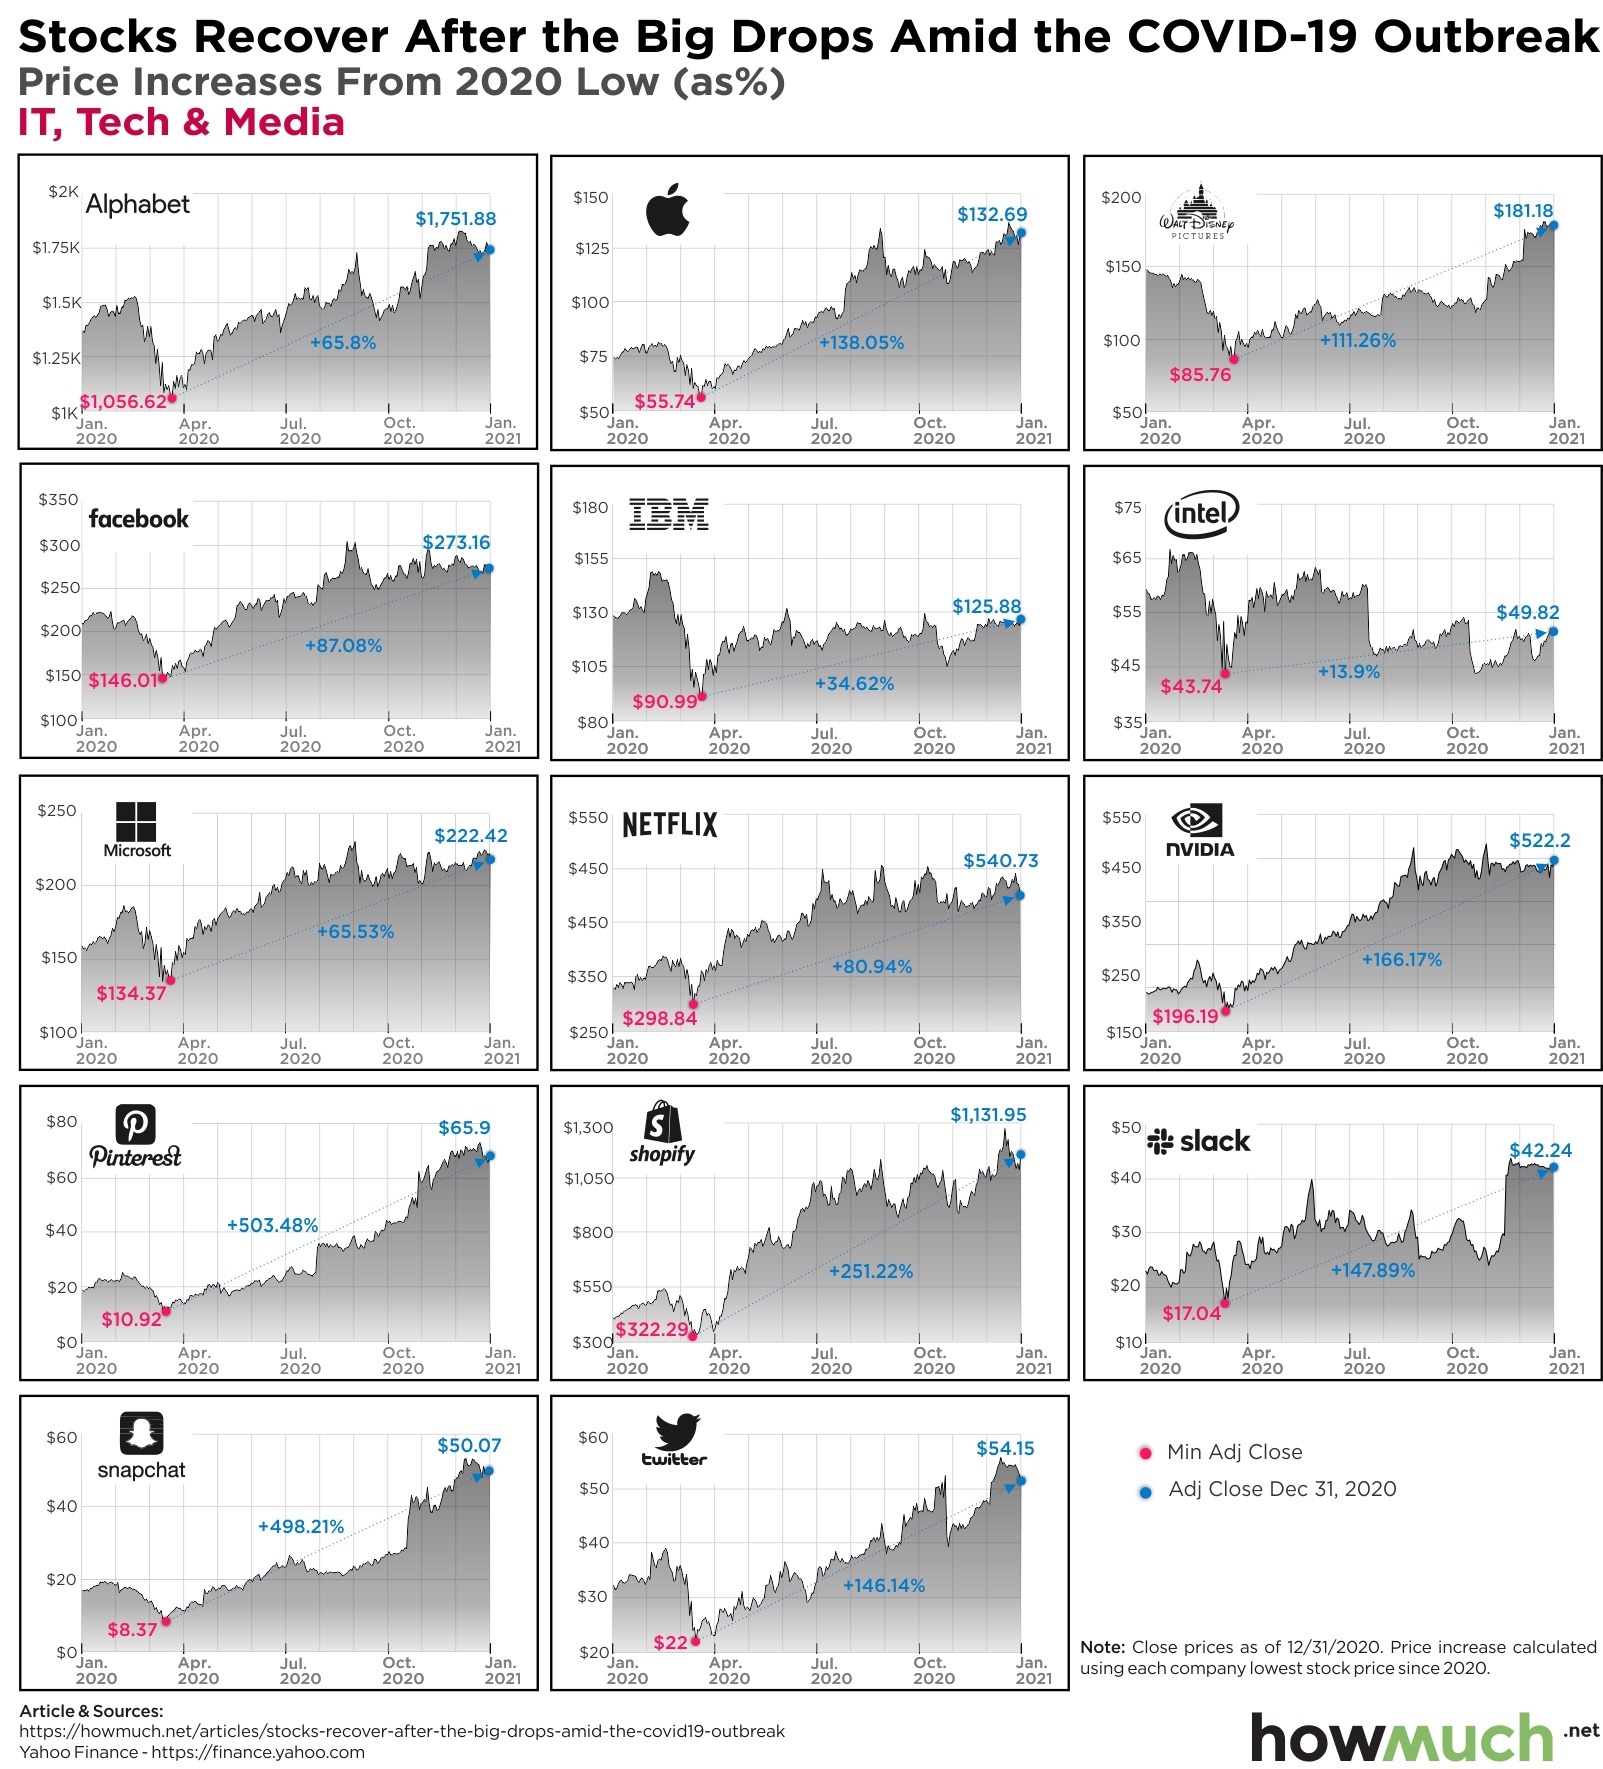
These charts show which companies have seen their stock prices improve by the end of 2020

February 8th, 2021
Personal Finance
debt
A lot of people are paying down their credit cards during the COVID-19 pandemic. These visualizations show which states and generations are making the most progress