
May 16th, 2018
The Economy
social-issues
The U.S. government spends more money on its military than the rest of the world, but how much more? Our new visualization ranks the top 15 countries in three different categories.

May 15th, 2018
Personal Finance
taxes
Income taxes are only one way the government can tax you. Our new map reveals which states have the highest and lowest average sales tax rates.

May 11th, 2018
Personal Finance
How much money do you need to make to afford a decent two-bedroom apartment in your state? Our new map reveals the eye-popping statistics behind the affordable housing crisis.

May 8th, 2018
Personal Finance
Americans owe more money on student loans than ever, but are there any affordable high-quality schools? Our map reveals the top programs costing under $20k in every state.

May 7th, 2018
The Economy
trade
President Trump’s trade war keeps heating up and the markets aren’t sure what to make of it. Our new map shows which sectors have the most valuable imports in every state.

May 2nd, 2018
Personal Finance
One driving mistake can bump up your auto insurance premium more than you think.

April 30th, 2018
The Economy
trade
If the United States is about to enter a trade war, which industries have the most to lose in the state where you live? Our new map shows the top export industries in every state.

April 27th, 2018
cryptocurrencies
This month Bithump and Coinrail lost a combined $71.5M to cyberthieves. Our visualization shows how the latest problems compare to the worst crypto hacks, Ponzi schemes, and ICO scams in history.

April 24th, 2018
The Economy
social-issues
Climate change is happening, but how will it impact the state where you live? Our new map reveals which places have the most to lose from rising temperatures and extreme weather events.
April 23rd, 2018
The Economy
social-issues
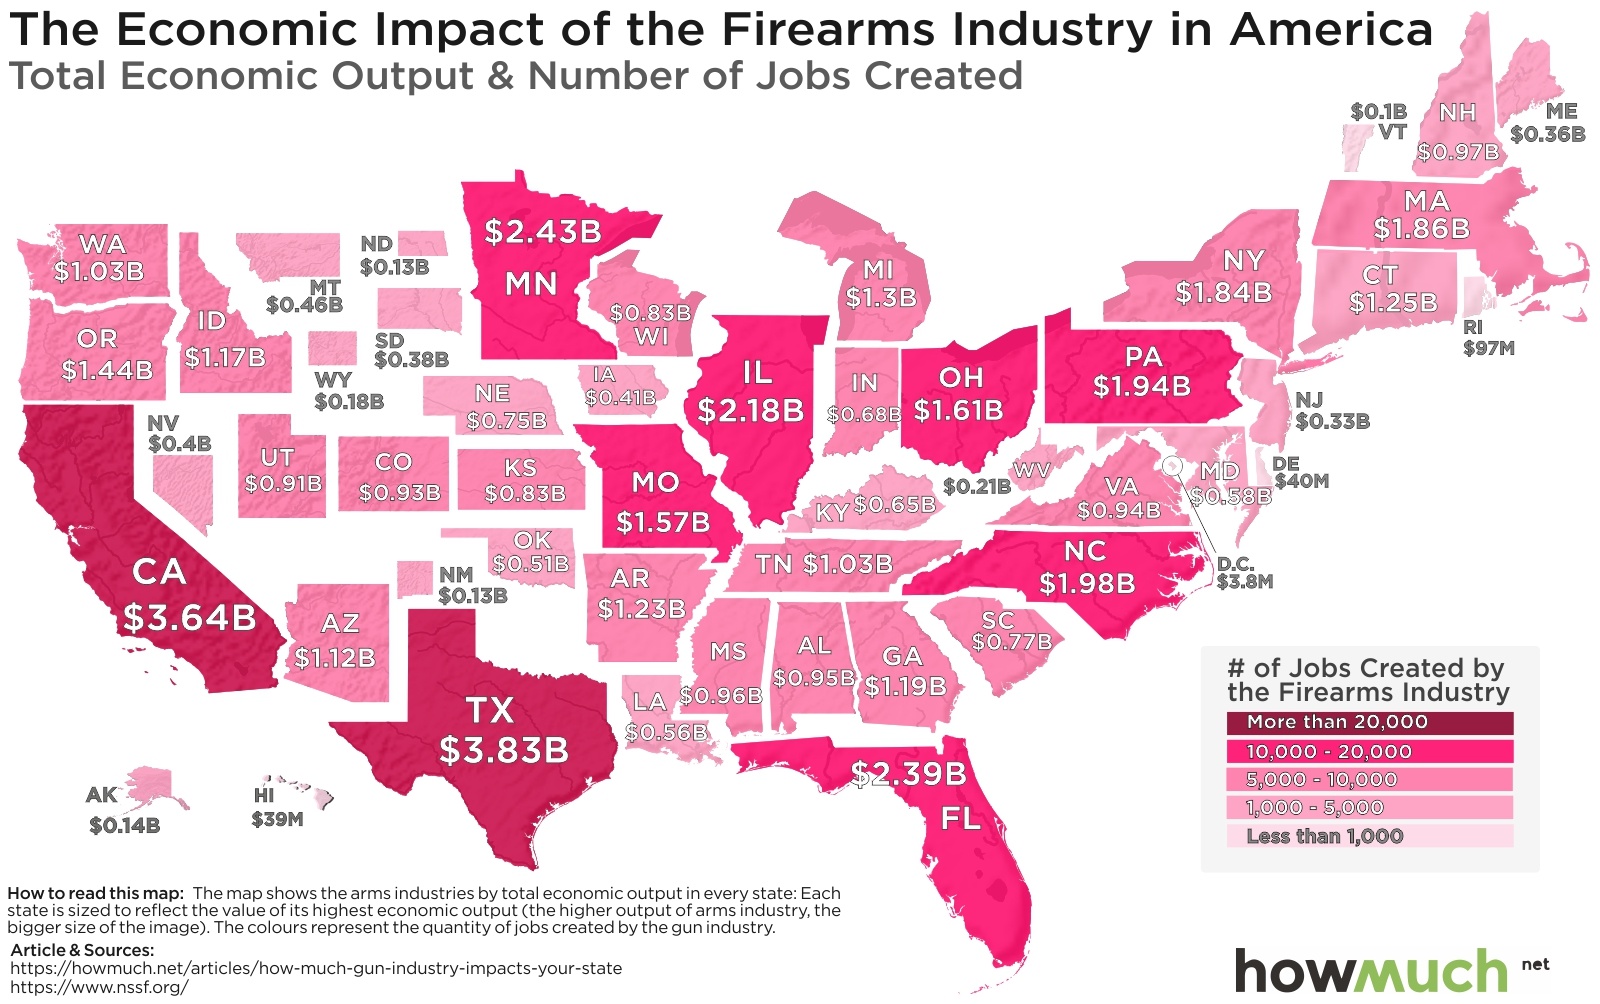
An overlooked aspect of the gun debate is how much the industry contributes to the economy. Our new map illustrates which states depend on gun manufacturers and shooting ranges for jobs and economic output.