
December 27th, 2019
Personal Finance
business
The Economy
taxes
debt
jobs
We covered lots of different topics in 2019, from the cost of a comfortable retirement to the looming government debt bubble and the world’s gold reserves. Here’s what we deemed the 10 best visualizations for the year

October 21st, 2019
jobs
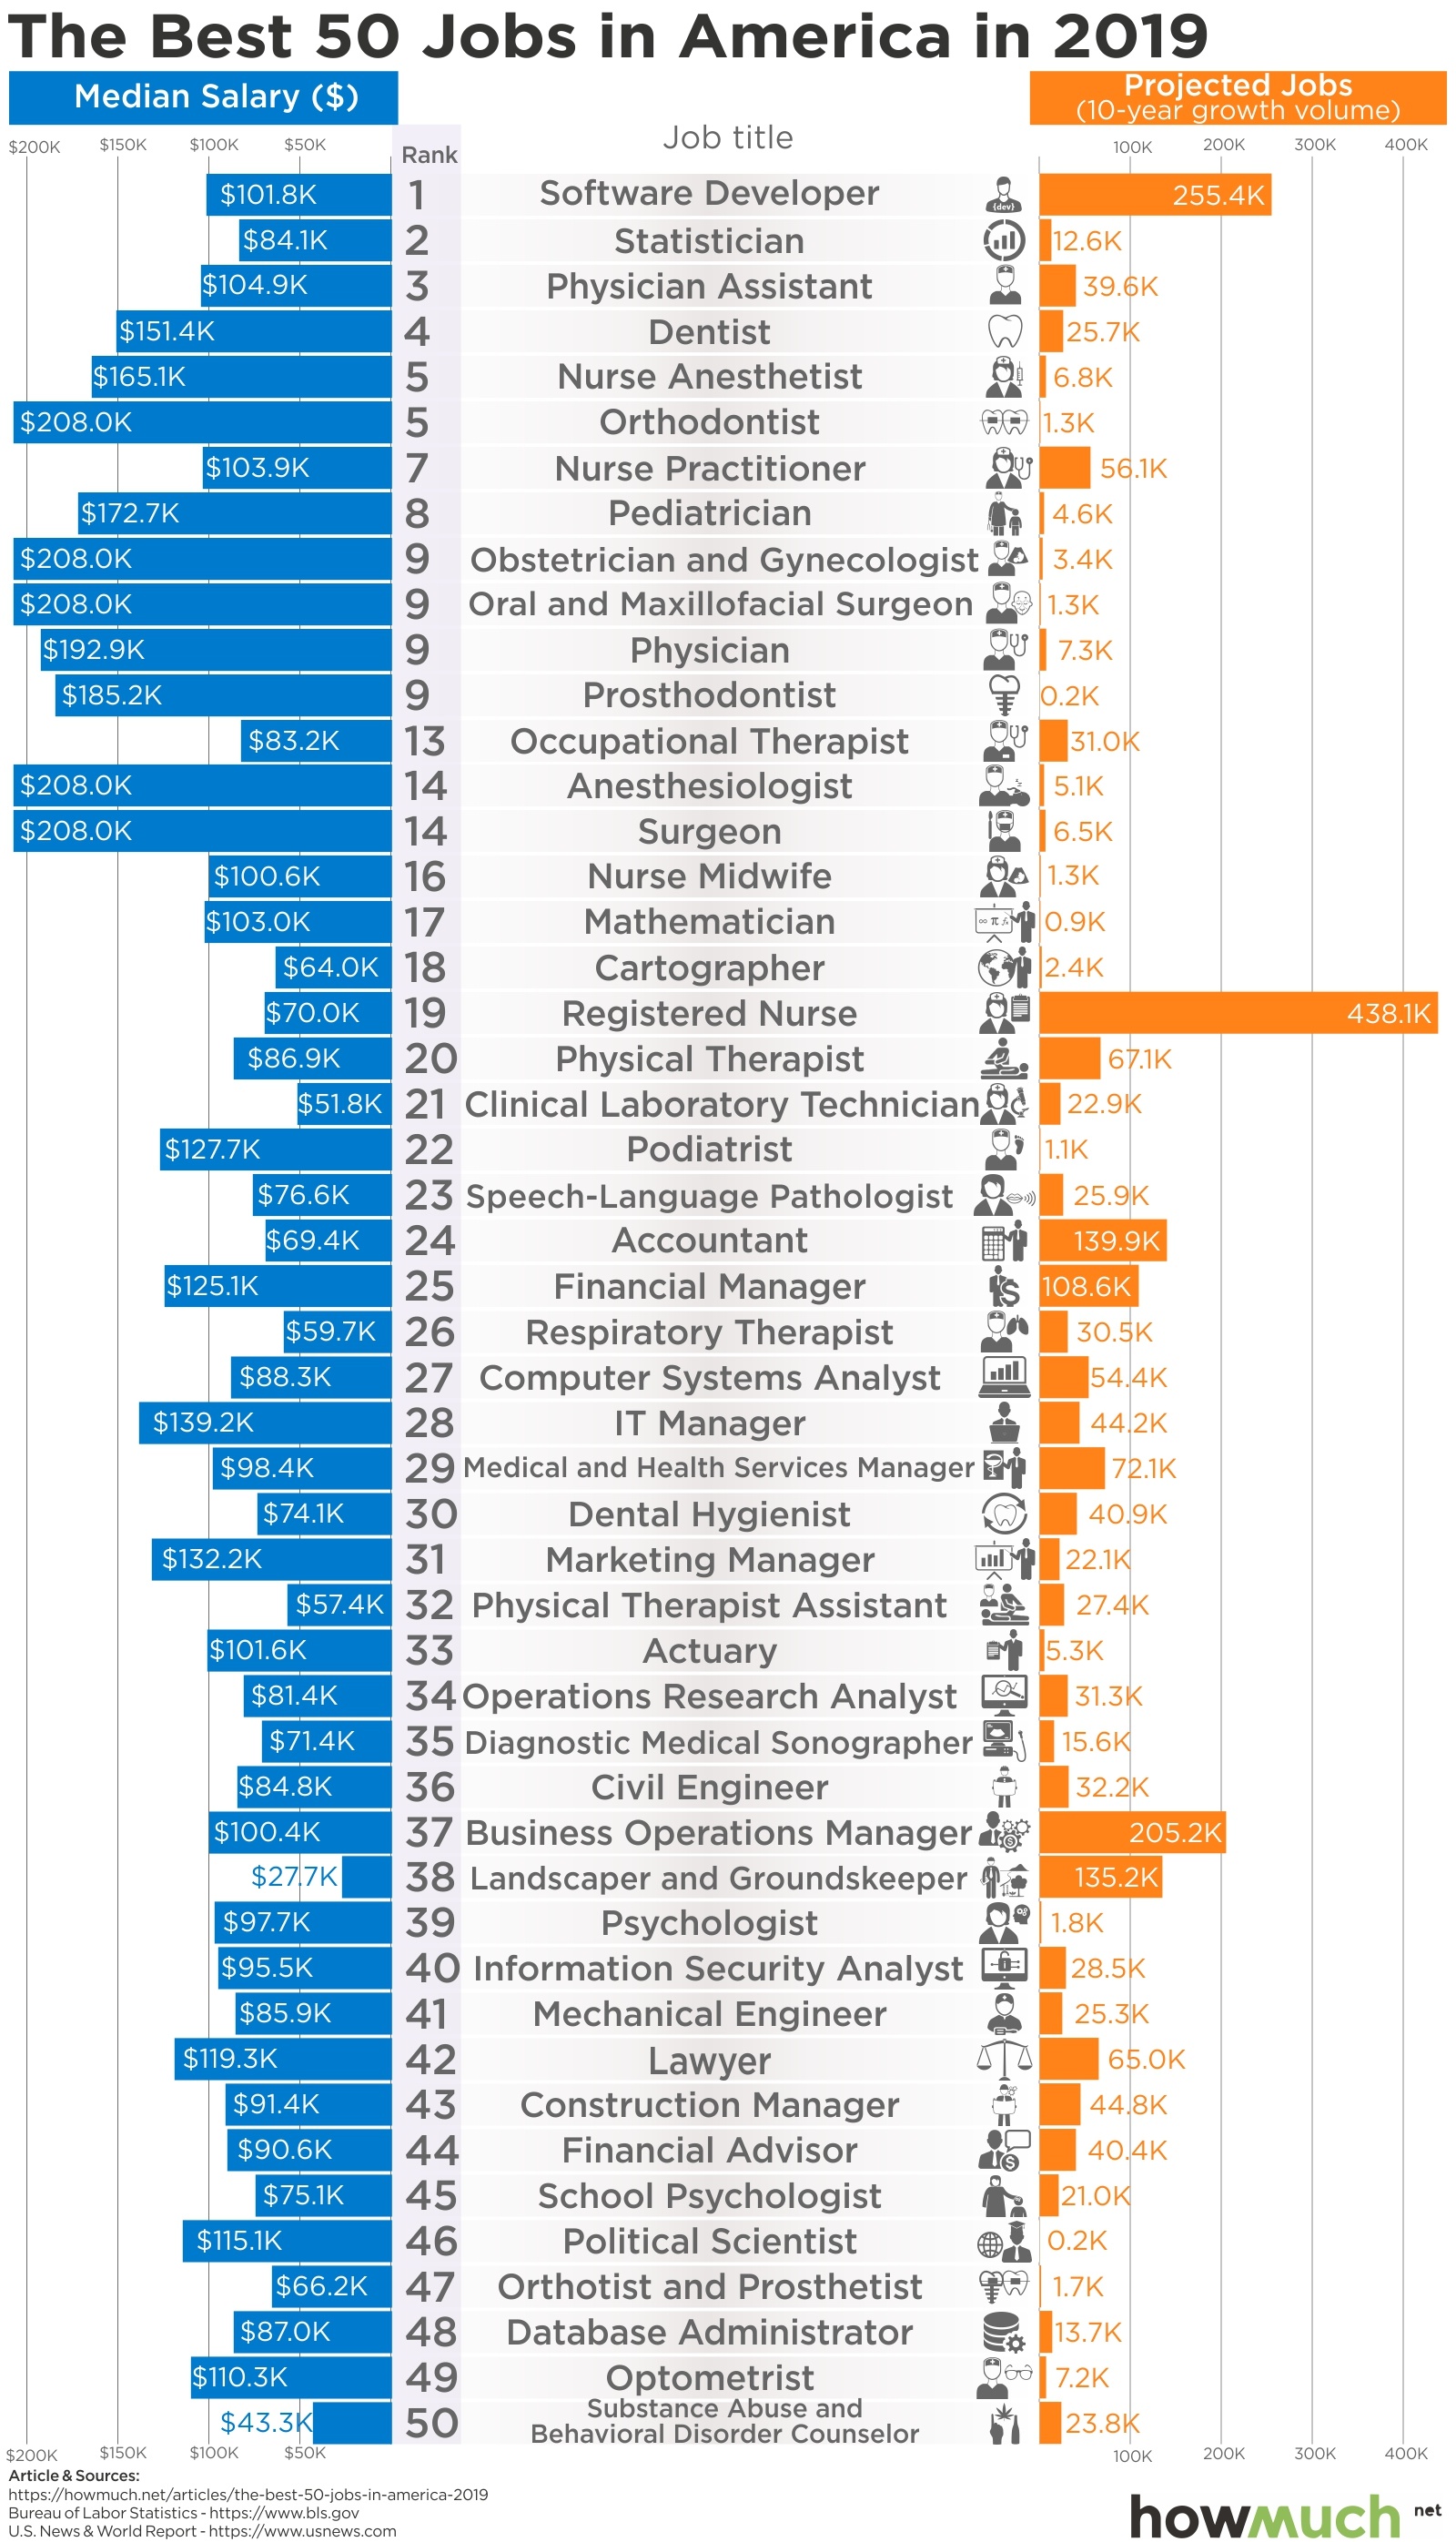
Healthcare, technology, management, and law lead the way when it comes to high-paying careers.

October 15th, 2019
business
jobs
Looking for a lucrative career? Research from Glassdoor shows that these are the highest-paying companies in the U.S.

September 16th, 2019
jobs
Finding the best colleges can be difficult. So we made it really simple. Check out the top college by state according to Forbes.

July 8th, 2019
business
jobs
2018 was a down year for stocks, but CEO compensation continued its unprecedented growth. Our viz highlights the CEO pay and returns of S&P 500 companies.

March 18th, 2019
Personal Finance
jobs
This graphic shows the mean yearly income of financial advisors in all 50 states. Their average salaries range between just over $76K in Vermont to more than $166K in New York

March 1st, 2019
jobs
Getting a job in technology is supposed to be a surefire way into the upper class. Our new map of average compensation for computer jobs reveals how it can vary dramatically across the country

February 6th, 2019
The Economy
jobs
Trump and Obama both claim credit for a strong economy and high job growth numbers. Our visualization shows you the real track record of job growth for each president going all the way back to the Great Depression.
January 18th, 2019
jobs
The best jobs almost always have a few things in common. They are in demand, pay well, and require some degree of training. If you’re thinking about a career change, this visualization is a good place to start.
January 16th, 2019
jobs
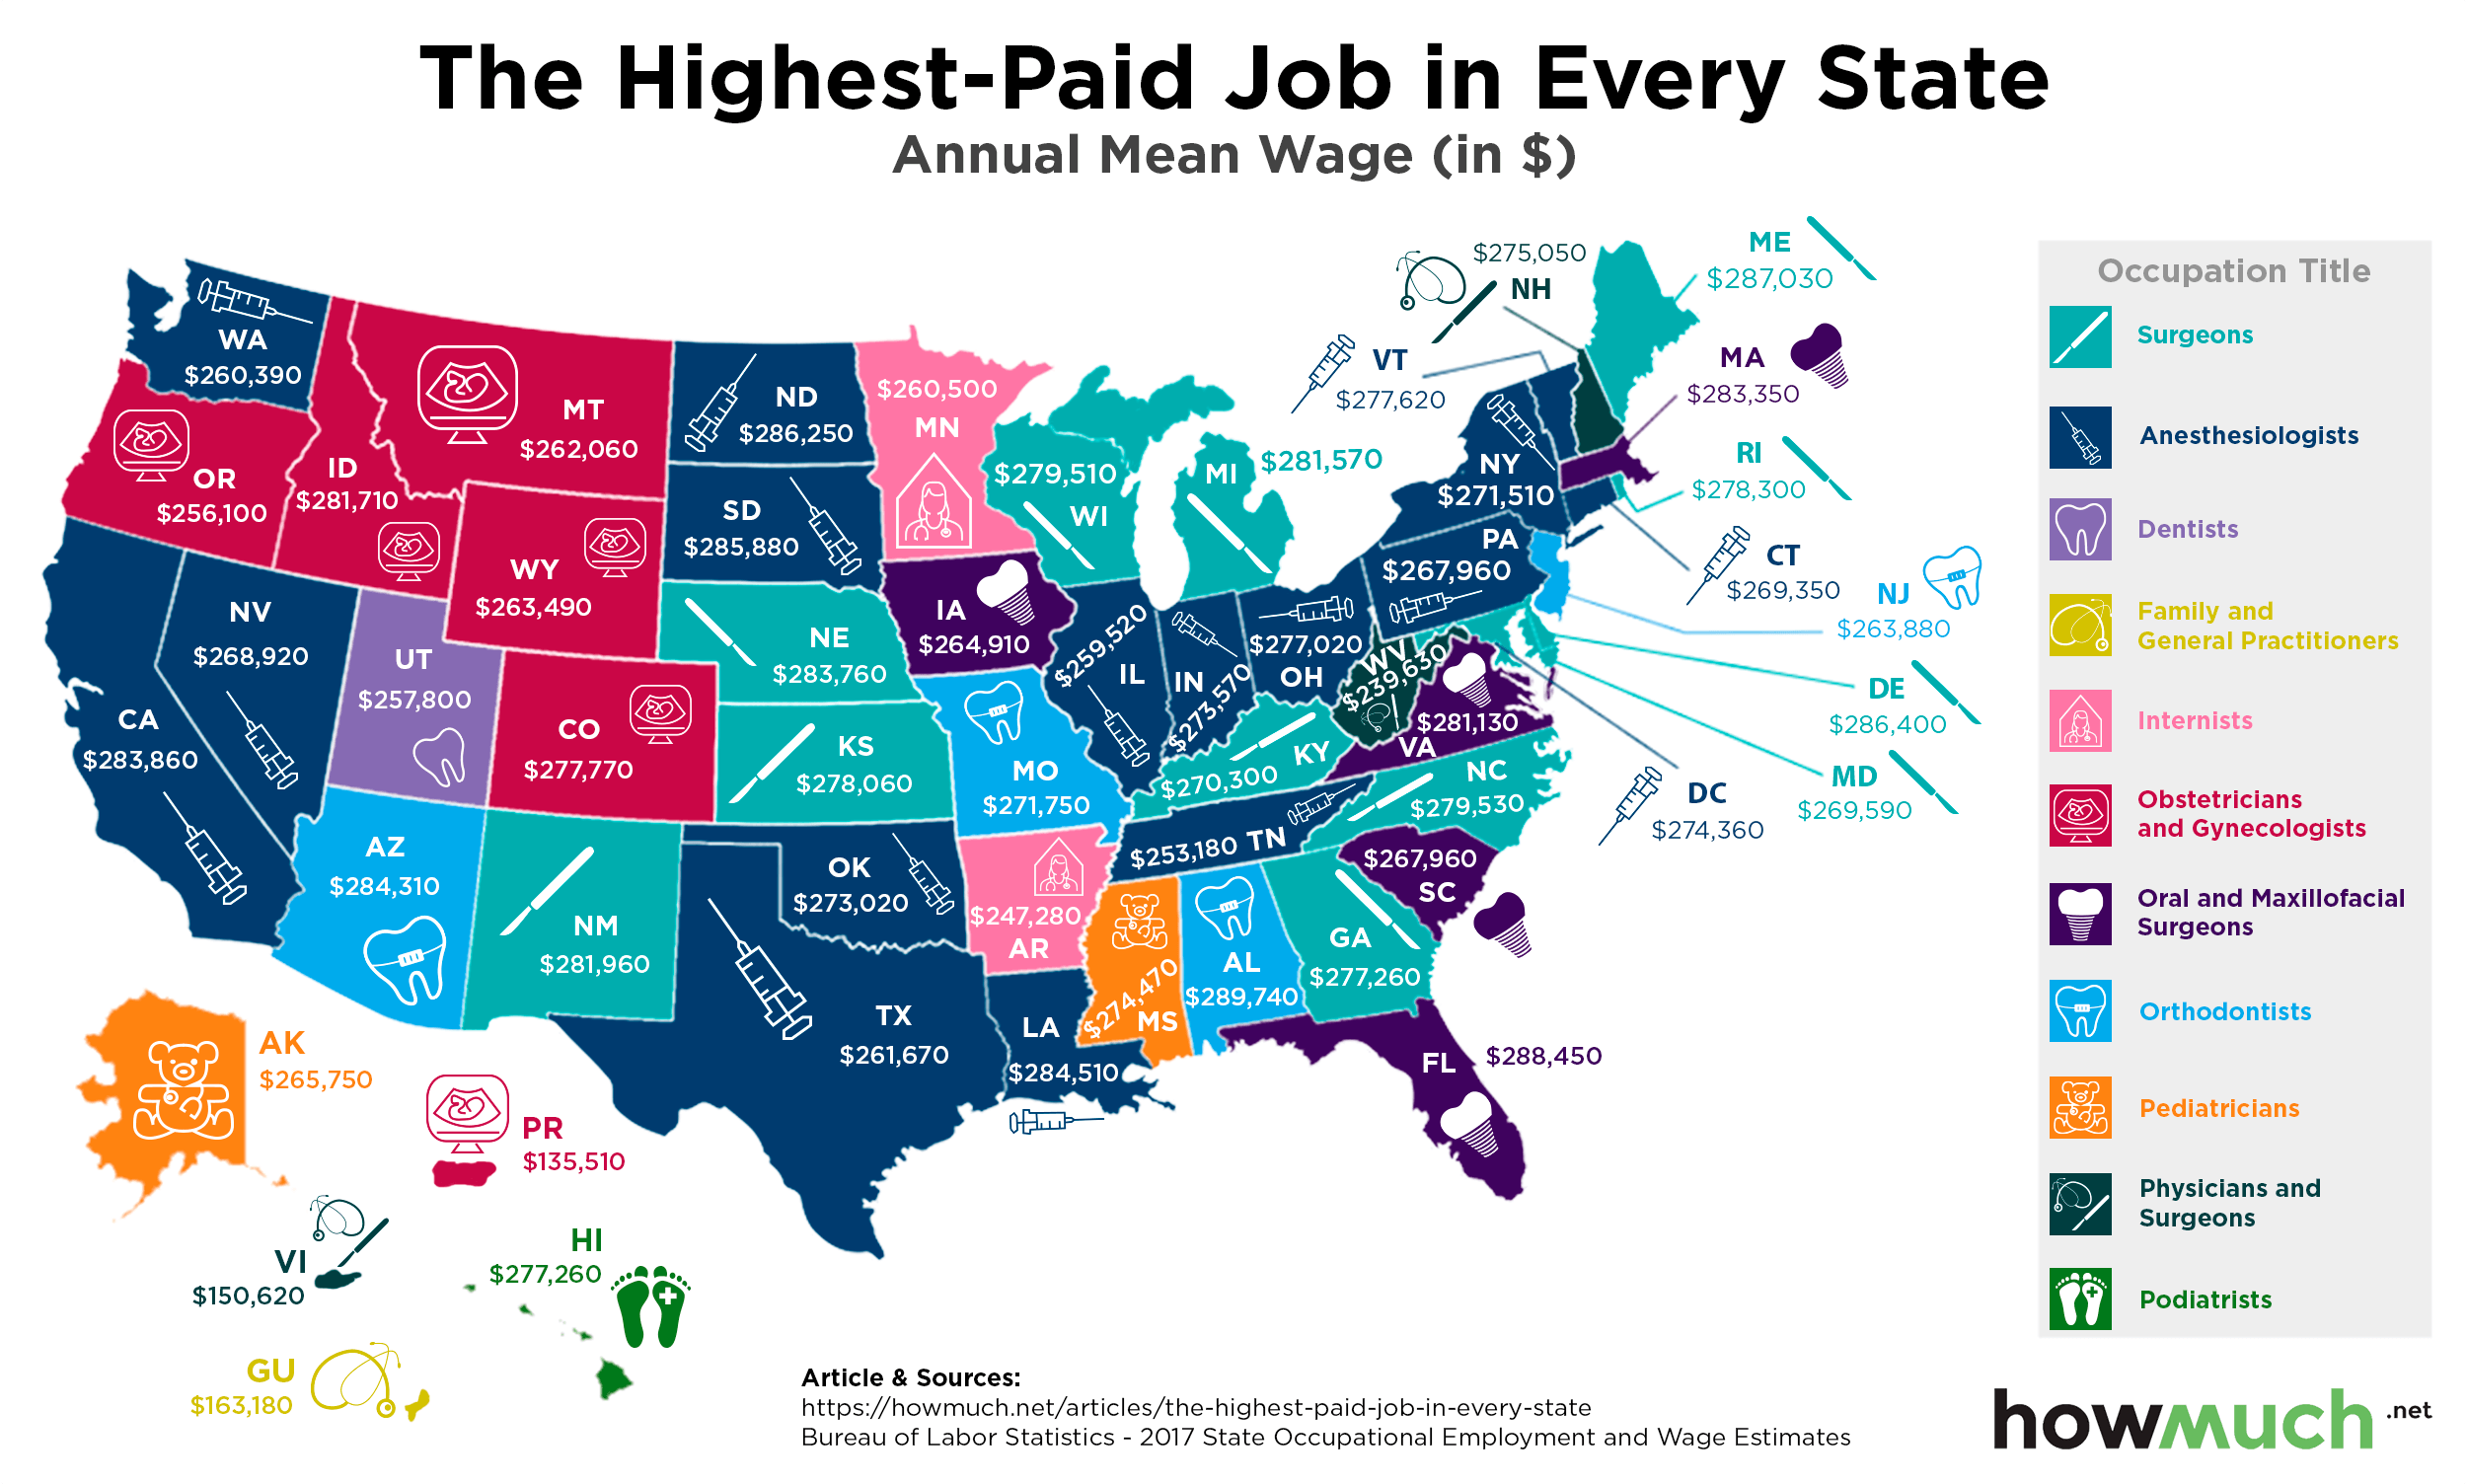
Making a six-figure income is a career milestone for most people, and it turns out the highest paid occupations make substantially more than that. Our newest map shows which jobs pay the best in each state.