January 7th, 2020
Personal Finance
business
social-issues
Wealth
jobs
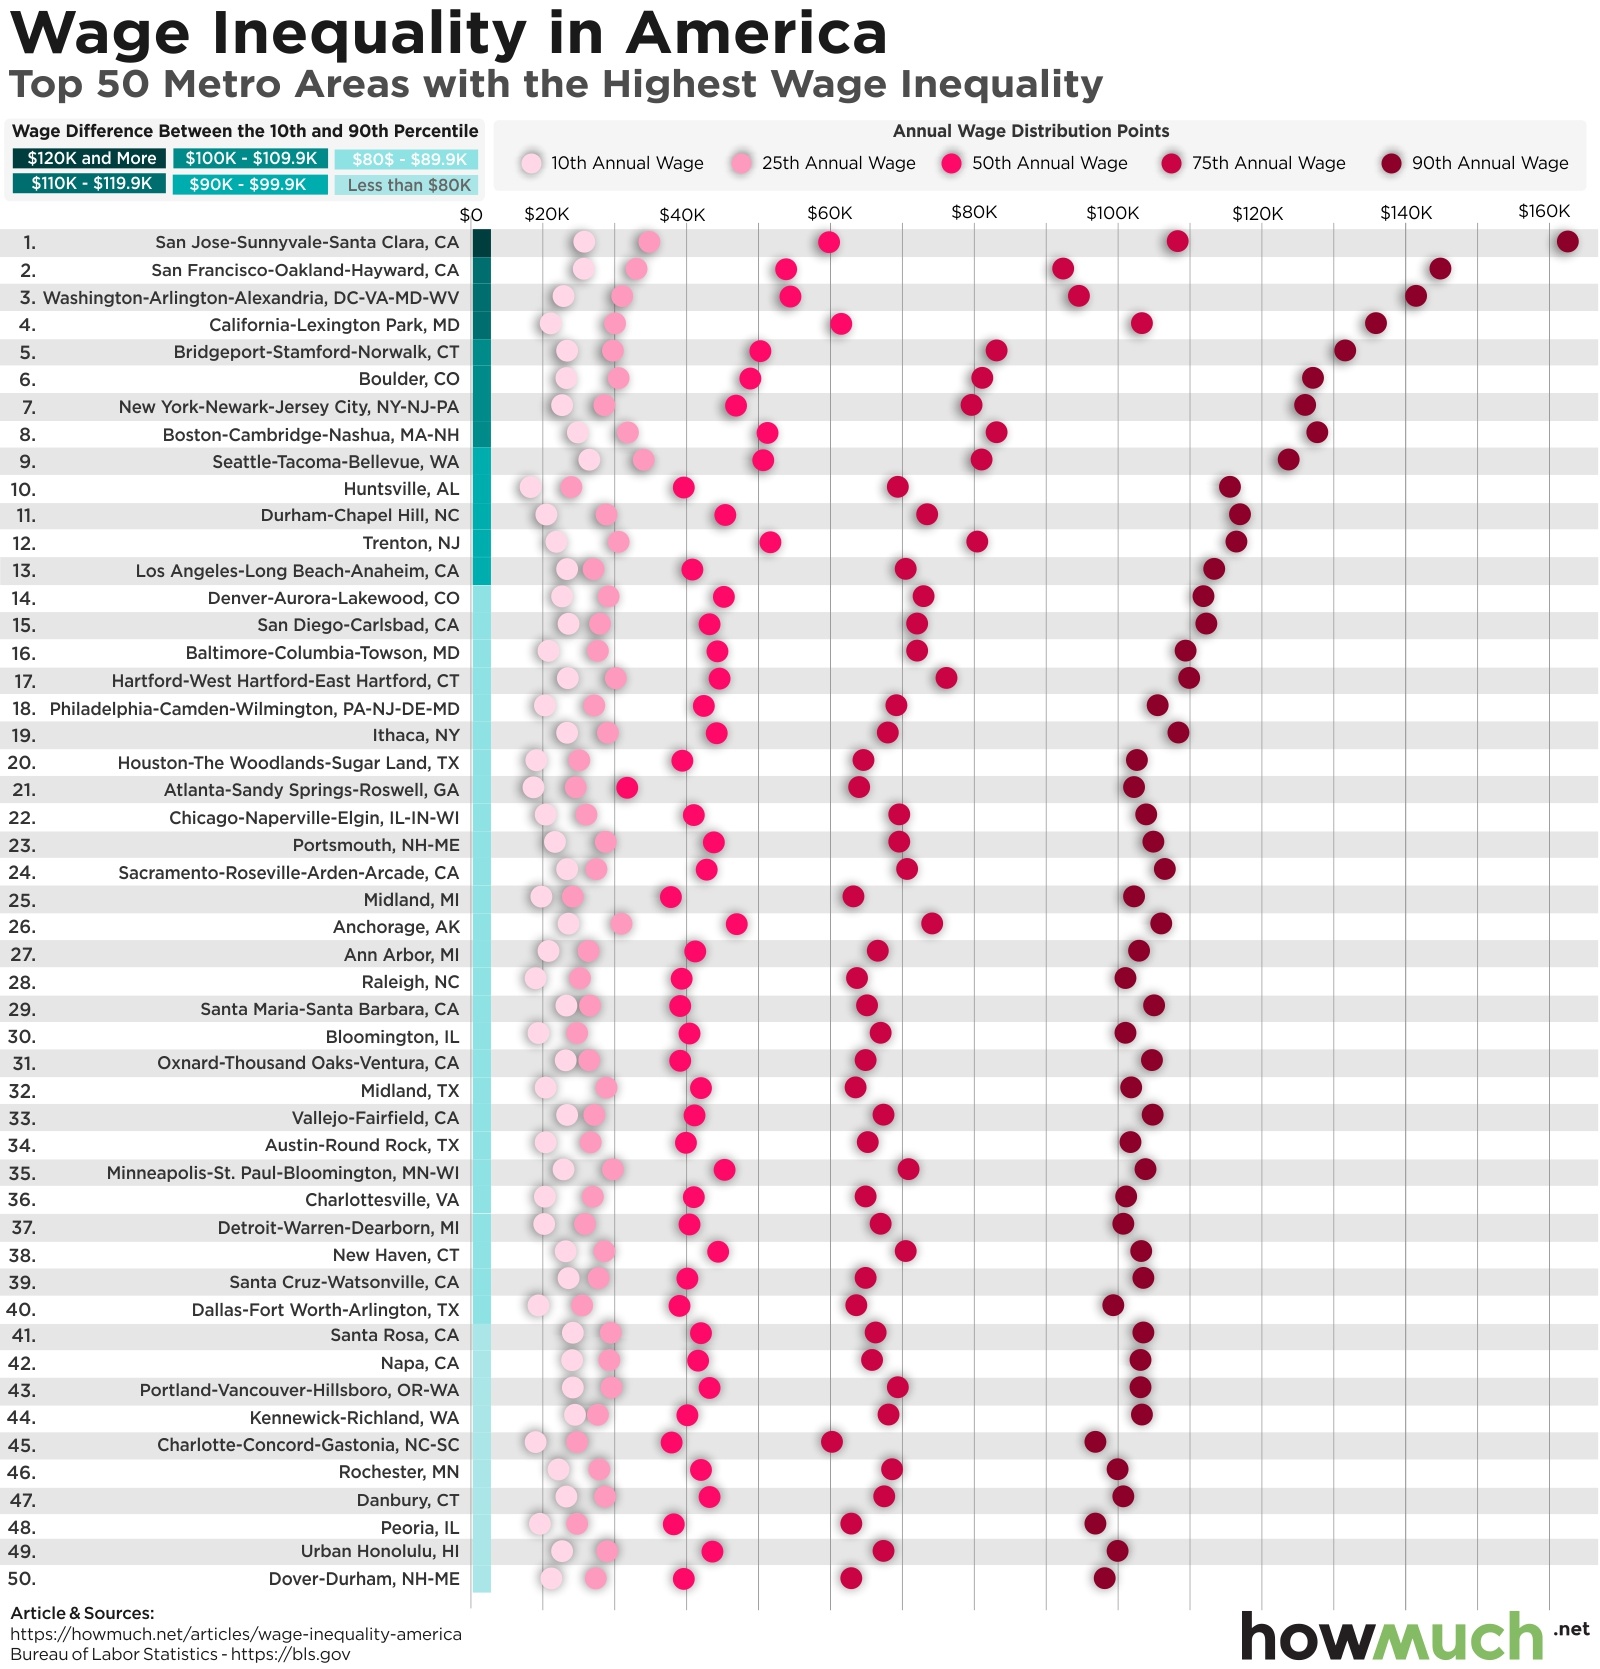
Income inequality is at an all-time high in America. This visualization breaks down the cities with the biggest gaps between high- and low-wage workers.

December 30th, 2019
Personal Finance
business
The Economy
social-issues
Wealth
What areas would you expect to drive U.S. economic output? Do more people equal more firepower, or does the location matter? Check out our county-level visualization to find out.

December 27th, 2019
Personal Finance
business
The Economy
taxes
debt
jobs
We covered lots of different topics in 2019, from the cost of a comfortable retirement to the looming government debt bubble and the world’s gold reserves. Here’s what we deemed the 10 best visualizations for the year

December 19th, 2019
business
From the Dutch East India Company to Saudi Aramco, these companies have earned the honor of being among the most valuable of all time

December 12th, 2019
business
Feel like you’re seeing ads from the same company over and over again? You probably are! Research from Ad Age reveals that these companies are spending the most on ads

December 9th, 2019
business
investments
Do you think Apple and Amazon are hot stocks? You’d have $9.2M if you invested $100 into Bitcoin

November 27th, 2019
business
There’s more money than ever sloshing around politics. Our latest visual breaks down U.S. presidential campaign expenditures since 1980.

November 5th, 2019
Personal Finance
business
investments
See how much money you’d have today if you invested $100 in these stocks 20 years ago

October 28th, 2019
business
Cloud computing is disrupting the economy. Our visualization reveals the top 25 private cloud companies, revealing how much money they’ve raised from private investors and how many people get to work there

October 15th, 2019
business
jobs
Looking for a lucrative career? Research from Glassdoor shows that these are the highest-paying companies in the U.S.