
May 29th, 2018
The Economy
social-issues
Hurricanes, heatwaves, and floods are inherently unpredictable, but do you know which ones caused the most damage? Our new visualization compares the cost of every natural disaster since 1980.
May 21st, 2018
The Economy
monetary-policy
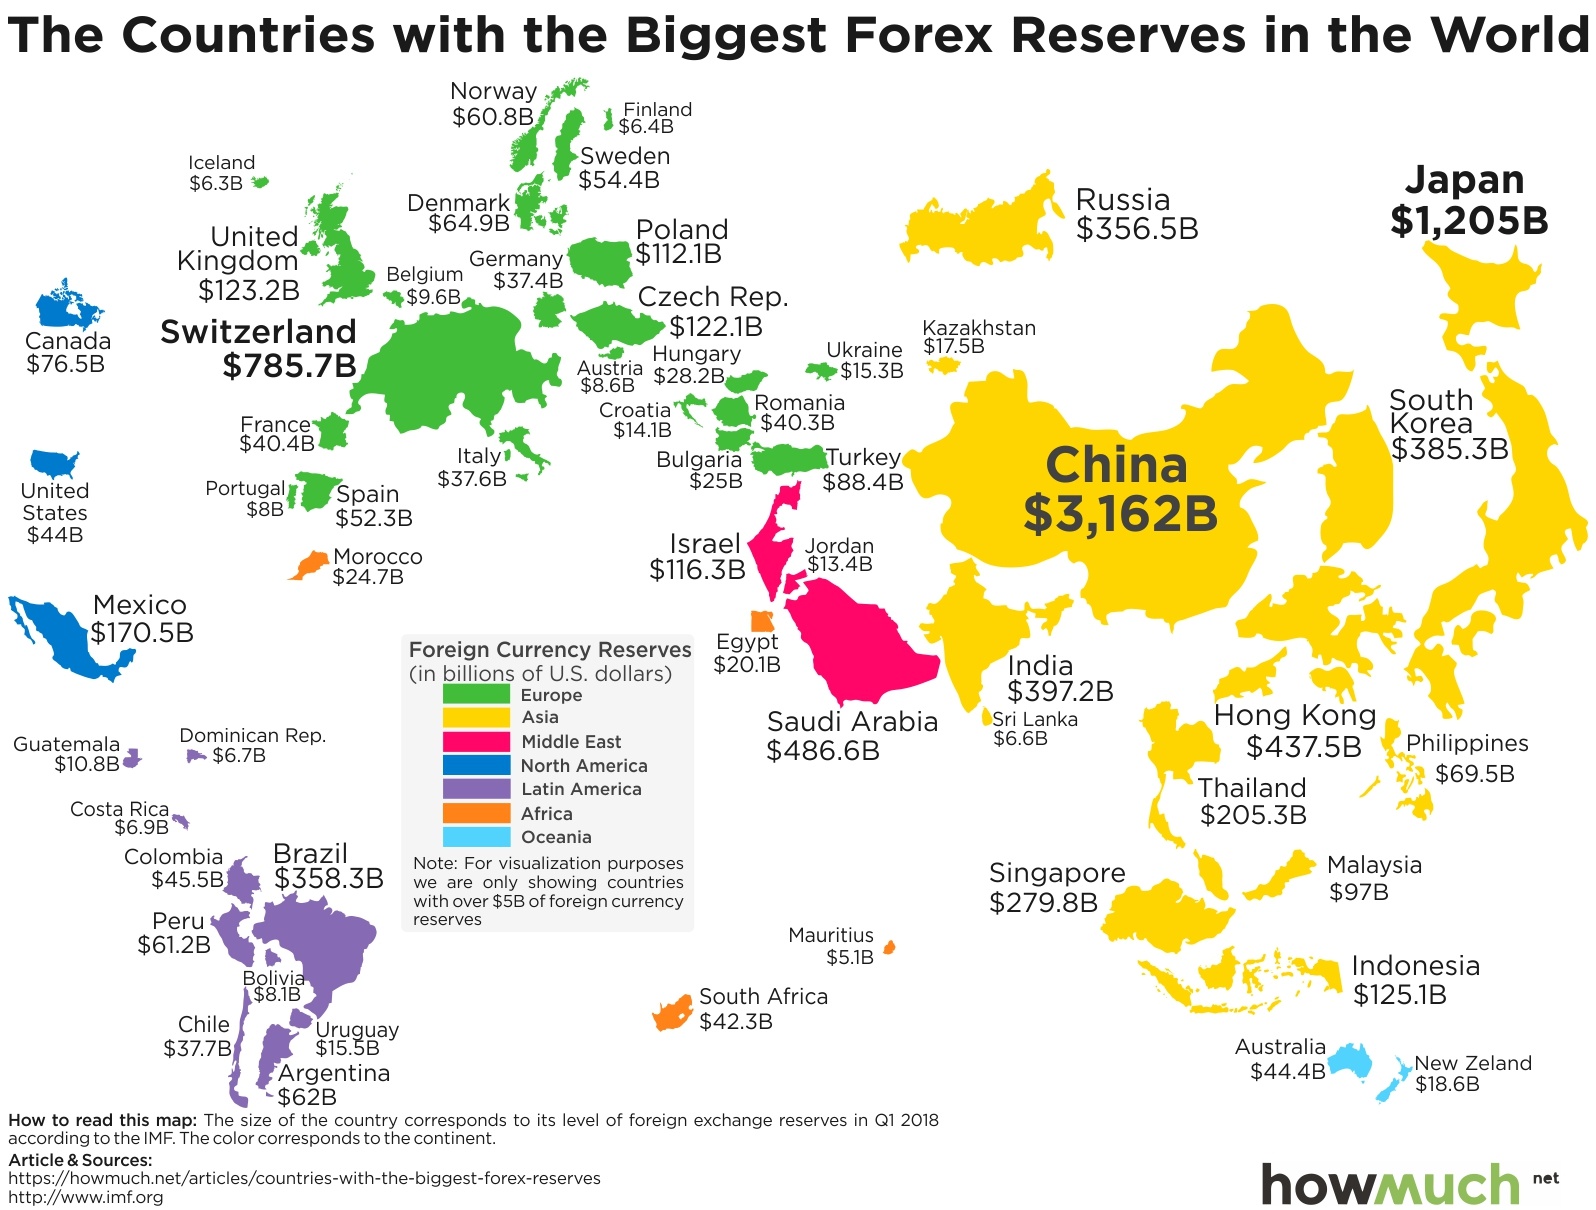
Want to see a leading indicator for how prepared a country is for an economic downturn? Check out our new map of foreign exchange reserves for every country in the world.

May 16th, 2018
The Economy
social-issues
The U.S. government spends more money on its military than the rest of the world, but how much more? Our new visualization ranks the top 15 countries in three different categories.

May 7th, 2018
The Economy
trade
President Trump’s trade war keeps heating up and the markets aren’t sure what to make of it. Our new map shows which sectors have the most valuable imports in every state.

April 30th, 2018
The Economy
trade
If the United States is about to enter a trade war, which industries have the most to lose in the state where you live? Our new map shows the top export industries in every state.

April 24th, 2018
The Economy
social-issues
Climate change is happening, but how will it impact the state where you live? Our new map reveals which places have the most to lose from rising temperatures and extreme weather events.
April 23rd, 2018
The Economy
social-issues
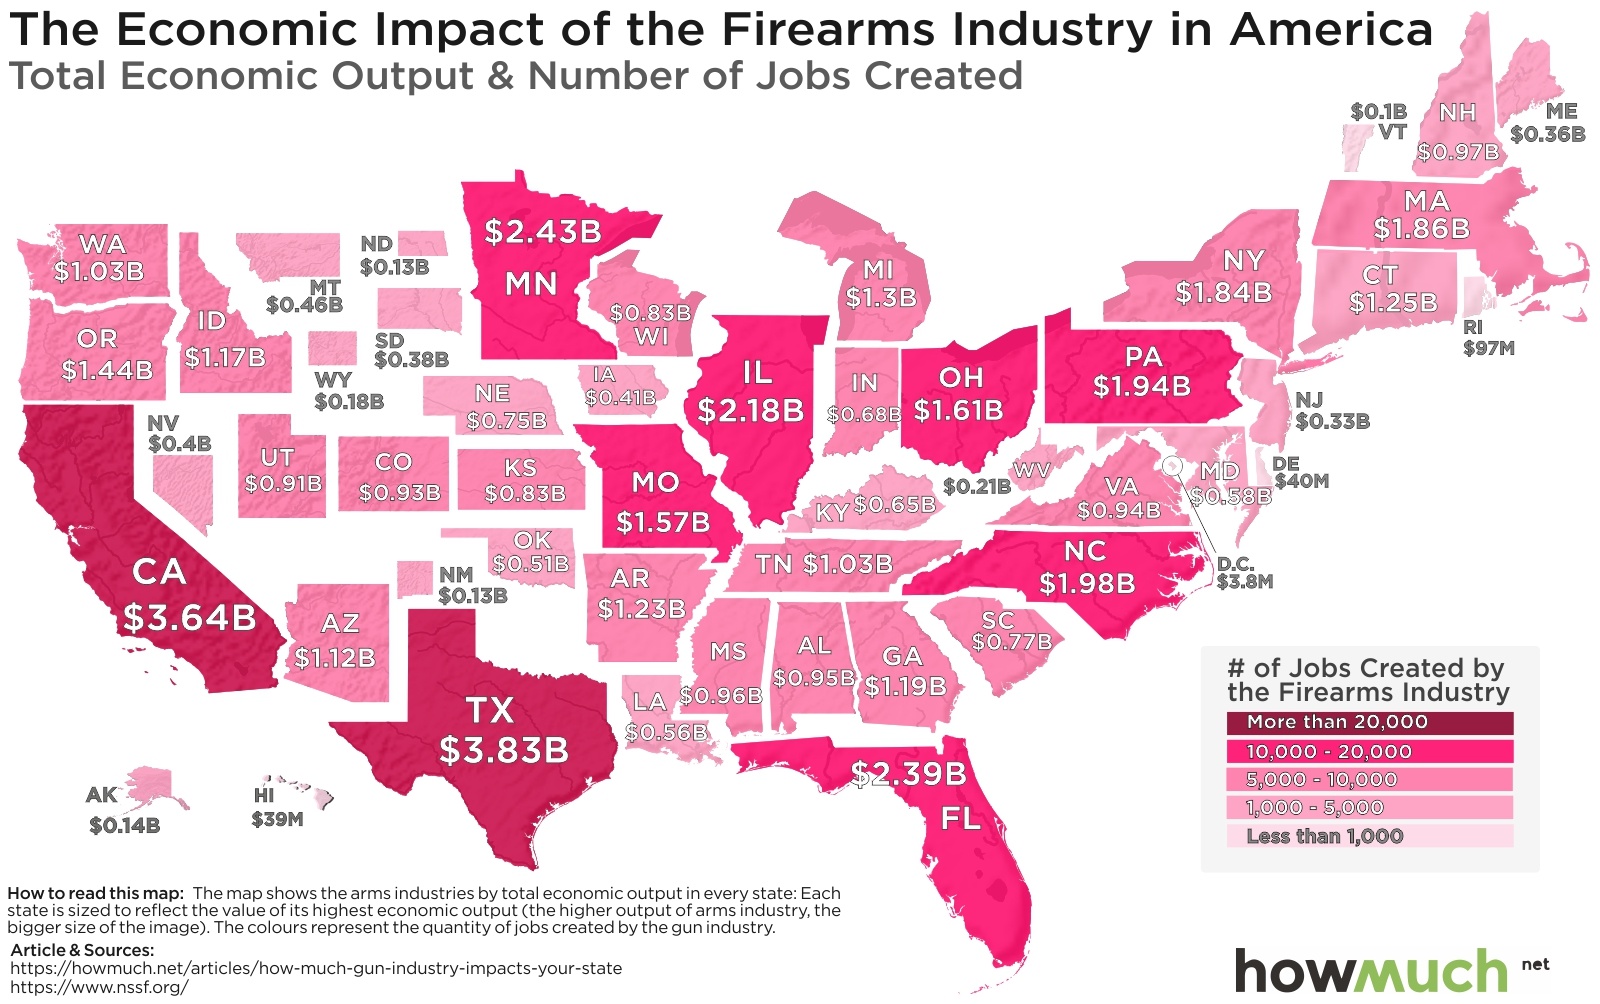
An overlooked aspect of the gun debate is how much the industry contributes to the economy. Our new map illustrates which states depend on gun manufacturers and shooting ranges for jobs and economic output.
March 27th, 2018
The Economy
social-issues
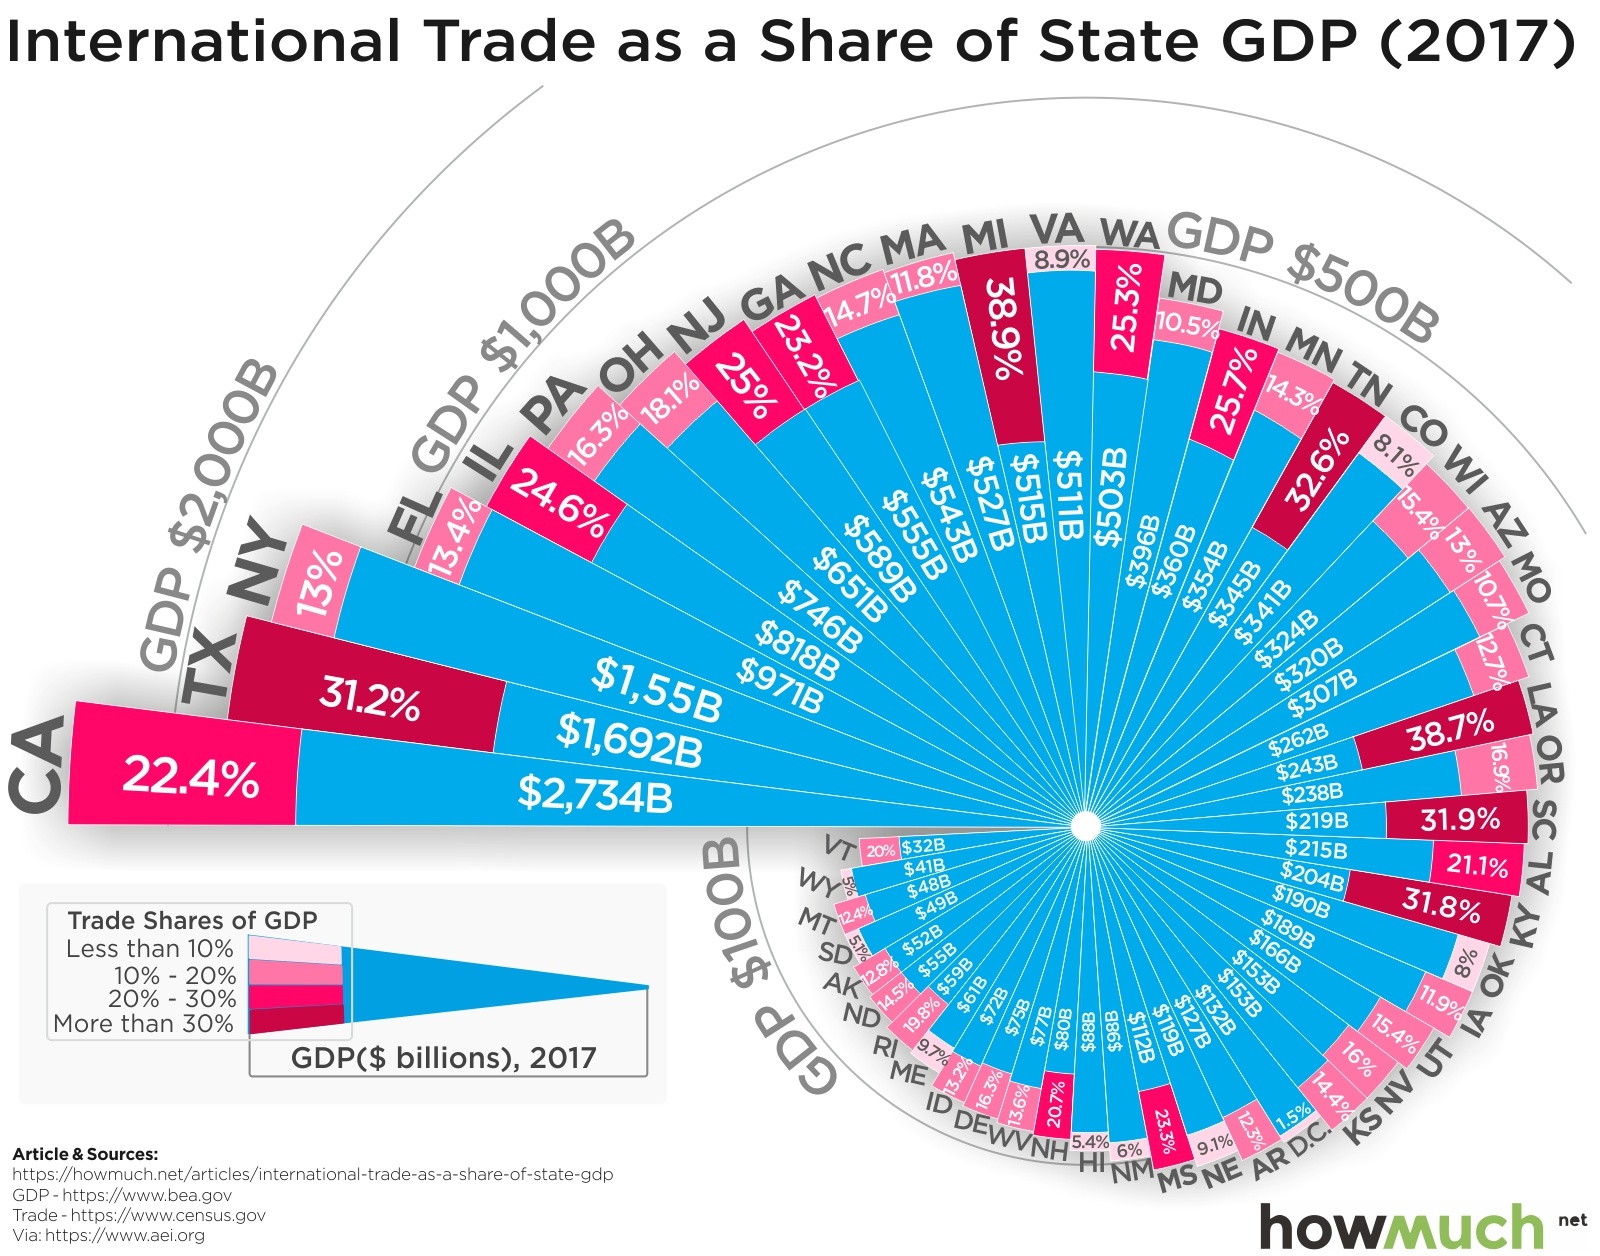
International trade is dominating the headlines, but how important is it to the broader economy? Our new graph breaks down how much each state’s GDP comes from importing and exporting goods.
March 22nd, 2018
The Economy
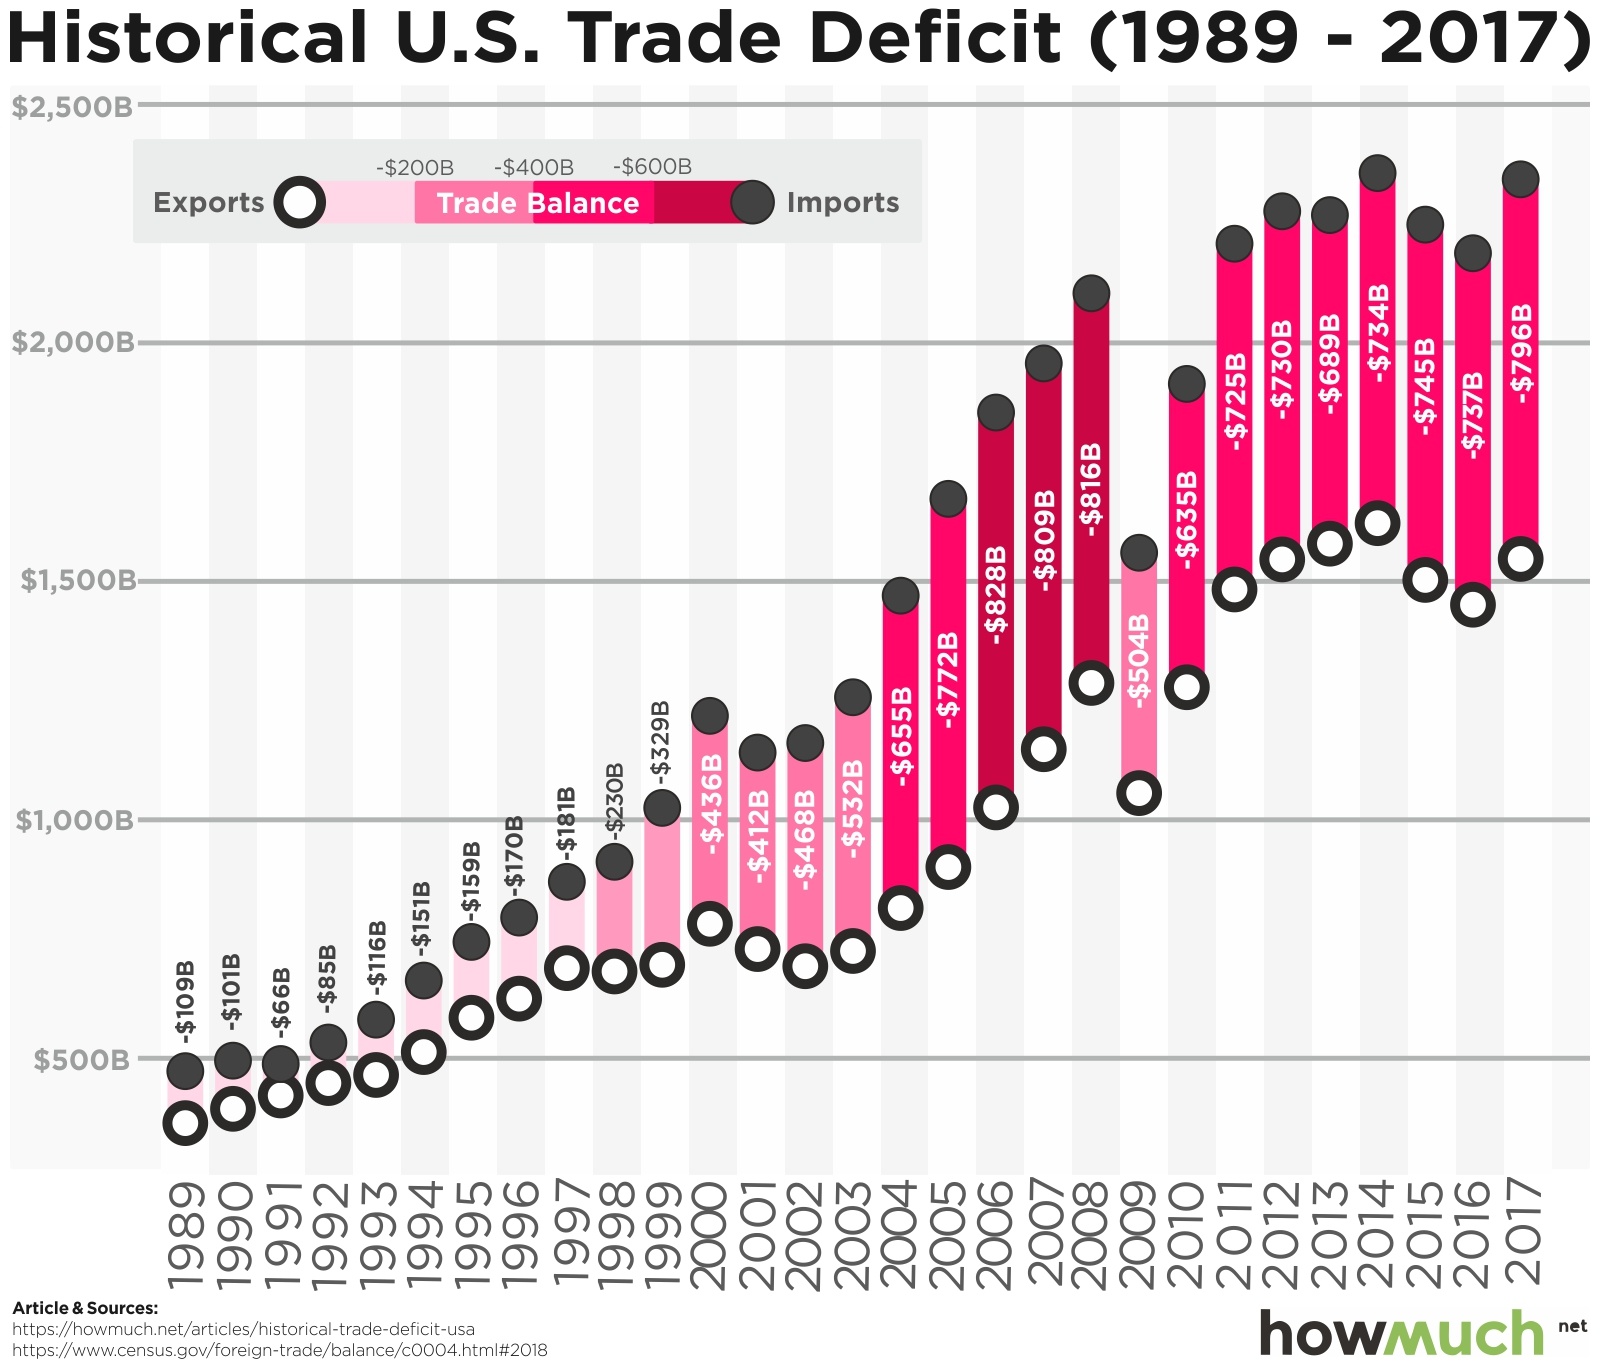
President Trump is currently focused on imposing tariffs to reduce the U.S. trade deficit. Our new graph illustrates the current situation.
March 13th, 2018
Personal Finance
The Economy
jobs
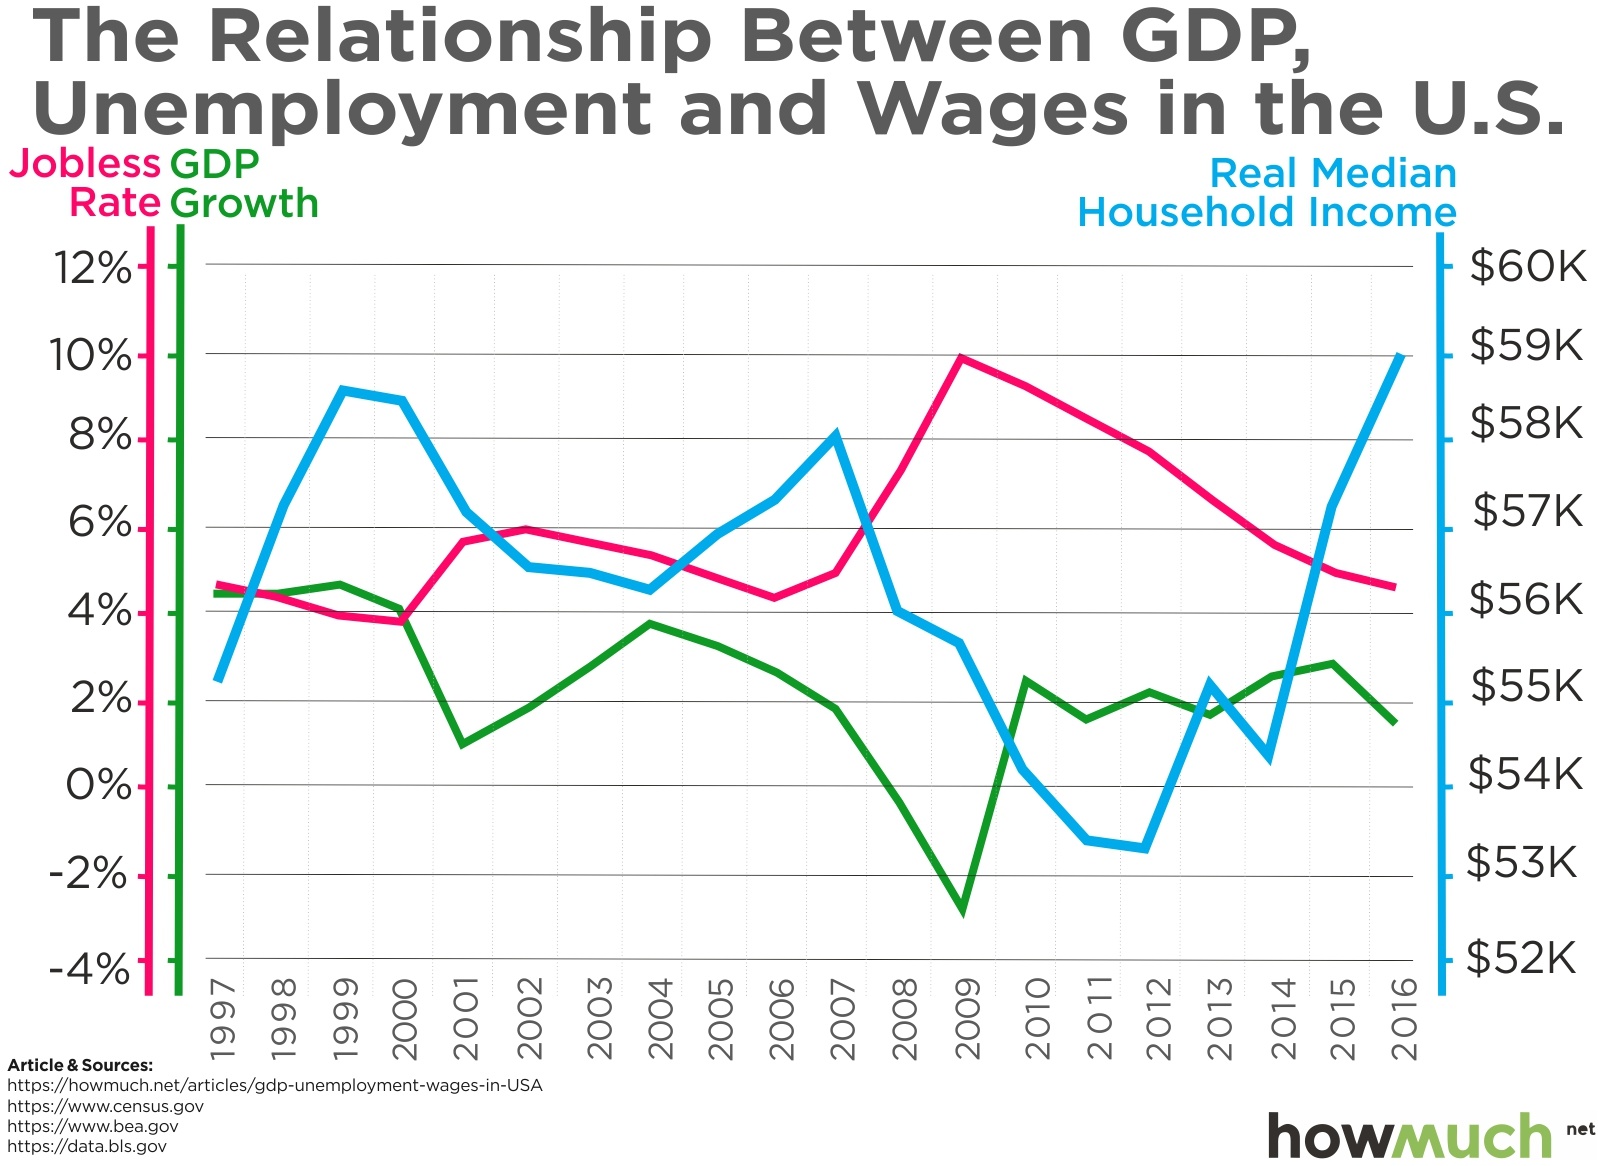
President Trump wants to see 6% economic growth during his administration. What would that mean for the American economy? Our new graph breaks down the relationship between GDP, unemployment, and wages.